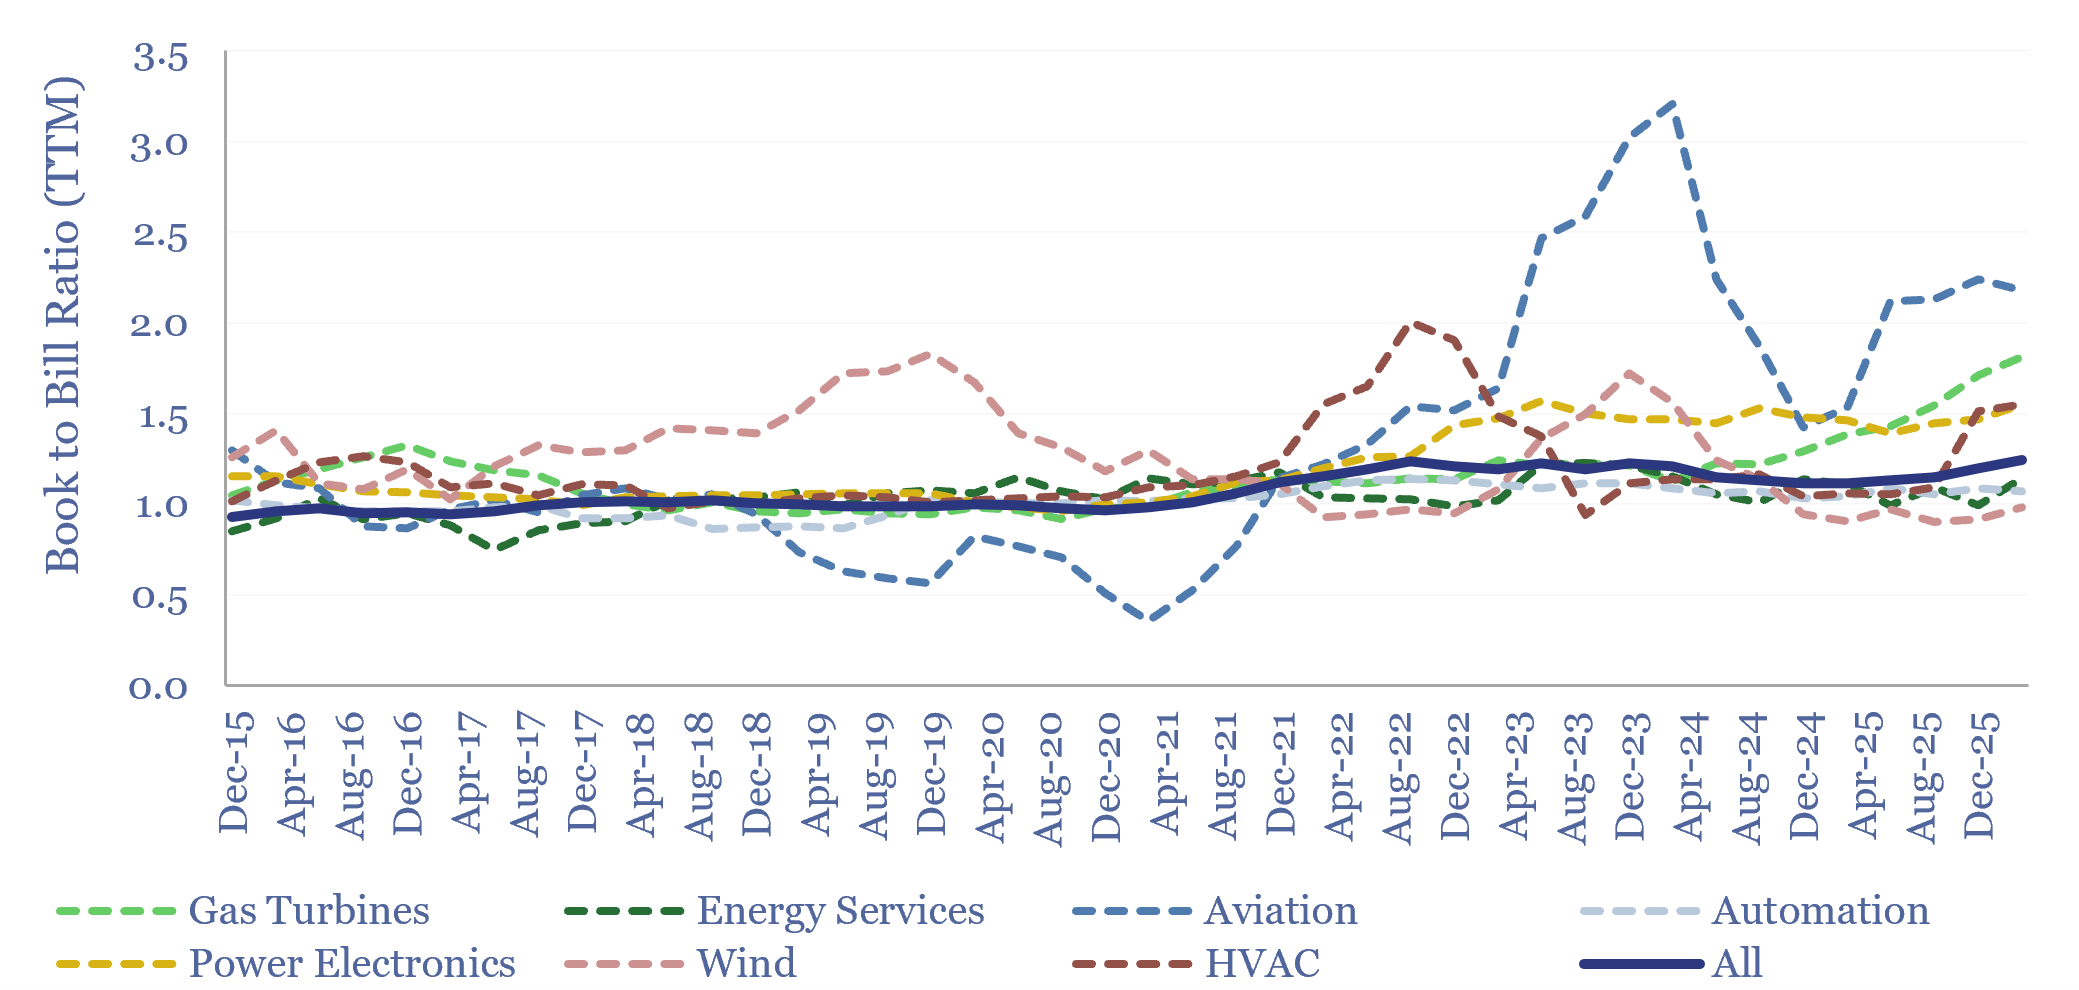
How long will boom times last in capital goods categories, including for AI data center construction? To answer this question, we have started tracking book-to-bill ratios, across 40 capital goods categories, from companies’ quarterly results. Booms occur when book-to-bill exceeds 1.5x, and typically last 2-years.
Book-to-bill ratios divide the new orders entering the backlogs of capital goods companies by the net revenues booked by the same operating segments in the same time periods.
Over the past decade, book-to-bill ratios have averaged 1.06x, across the forty capital goods sub-segments tracked in this data-file. The ratio is above one as both prices and volumes have grown over time.
It is currently an unusual time in capital goods, because the book-to-bill ratio across all 40 sub-segments we are tracking in this data-file is at 1.24x, in the trailing twelve months ended March-2026, which is the highest at any point in the past decade.
Moreover, four out of our seven capital goods sub-indices are posting book-to-bill ratios above 1.5x: aviation, gas turbines, HVAC and power electronics.
We can only count five prior examples over the past decade where the book-to-bill ratio jumped above 1.5x for one of our capital goods sub-segment indices. The average of these episodes lasted 2-years. And 60% were also associated with some kind of ‘reversion’ behaviour.
Aviation shows the most volatile book-to-bill ratio over the past decade, troughing at 0.35x in the trailing twelve months after the onset of the COVID-19 lockdowns, then rocketing back to 3x in the aftermath, as airline orders played catch-up.
Wind industry book-to-bill shows the opposite trajectory, rising from 2017 to a peak of 1.8x in 2019, then falling back to 0.95x over the past two-years.
Power electronics growth has clearly accelerated, with a book-to-bill ratio averaging 1.06 from 2015 to 2021, then stepping up, and consistently running at 1.5x through to the latest quarterly data in early-2026. This is the longest stretch of high book-to-bill ratios for any sub-segment in our data-file.
Gas turbines’ book-to-bill averaged 1.09x from 2015 to 2023, then progressively stepping up. 4Q25 was the best quarter in our data-series, reaching 2.2x, and 1Q26 remained historically strong at 1.9x.
HVAC-related book-to-bills ratios were 1.07x from 2015-2020, stepped up during the ‘work from home’ era in COVID, normalized, and are now rising again, reaching 1.6x in the past year, possibly linked to data center build-out.
The full data-file tracks book-to-bill ratios from operating segments reported by ABB, Airbus, Alfa Laval, Atlas Copco, Baker Hughes, Boeing, Doosan Enerbility, Emerson, GE Vernova, Johnson Controls, Mitsubishi Heavy, Munters, NOV, Siemens Energy, Subsea 7, Technip Energies, Trane, Vertiv, Vestas, Wärtsilä.
Respect to companies from ABB to Wärtsilä that have consistently reported book-to-bill ratios, and ideally also backlogs, every quarter, in a way that is comparable over time.
We will continue tracking book-to-bill ratios, and adding more sub-segments into this data-file over time. The data-file will be updated quarterly for TSE subscription clients.