Carbon Intensity
-
US industrial furnaces: breakdown by size, by industry, by fuel?
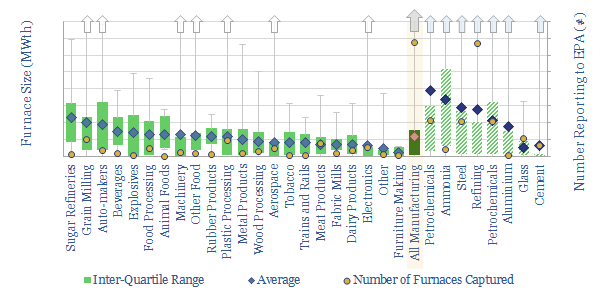
There are 1,500 industrial furnaces in the US manufacturing sector, with average capacity of 60MWth, c90% powered by natural gas, and thus explaining over 3.5 bcfd of US gas demand (4-5% of total). This is an unbelievably complex landscape, but we have captured as much facility-by-facility data as possible.
-
CO2 capture: a cost curve?
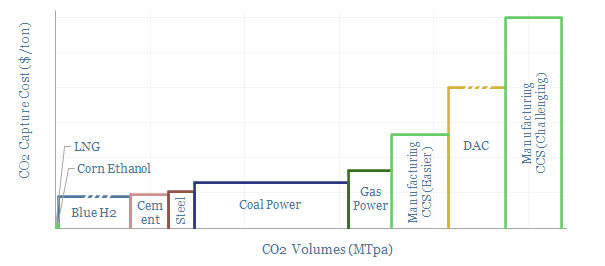
This data-file summarizes the costs of capturing CO2. The lowest-cost options are to access pure CO2 streams that are simply being vented at present. Next are blue hydrogen, steel and cement, which could each have GTpa scale. Power stations place next, at $60-100/ton. DAC is carbon negative but expensive.
-
Cost and CO2 intensity of home cooking technologies?
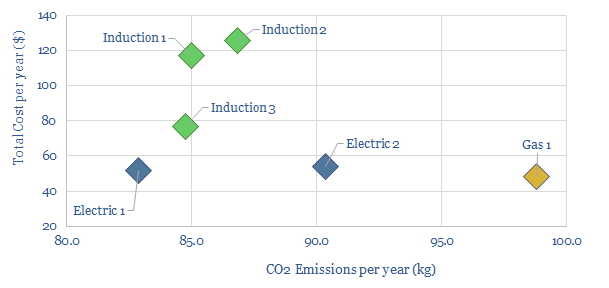
The most important determinant of cooking’s CO2 intensity is consumer behaviour. At today’s energy costs and grid mix, gas-fired cooking yields the lowest costs. Sometimes electrification of cooking will decrease CO2 and sometimes not. Electric induction is most efficient, but 2-3x more expensive than gas and electric hobs.
-
Construction materials: a screen of costs and CO2 intensities?
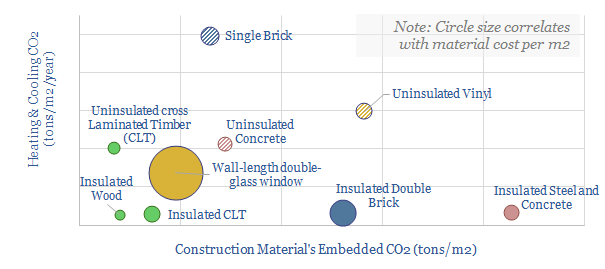
This data-file calculates the costs, the embedded energy and the embedded CO2 of different construction materials, both during their production and for ongoing heating and cooling. Insulated wood and cross-laminated timber have the lowest CO2 intensities and can be extremely cost competitive.
-
Blue carbon: how much degradation and CO2 emission?
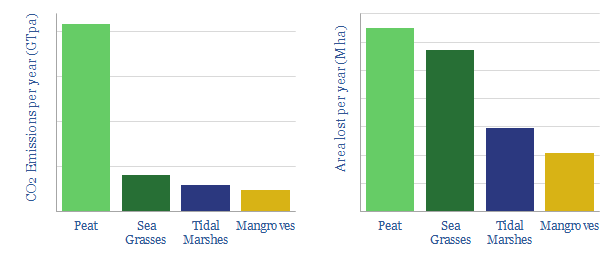
This data-file illustrates the outsized contribution of blue carbon ecosystems in the carbon cycle, looking across mangroves, tidal marshes, sea grasses and peat bogs. Degradation of blue carbon ecosystems continues with vast CO2 consequences, comparable to the entire global cement industry.
-
CO2 concentrations in industrial exhaust streams?
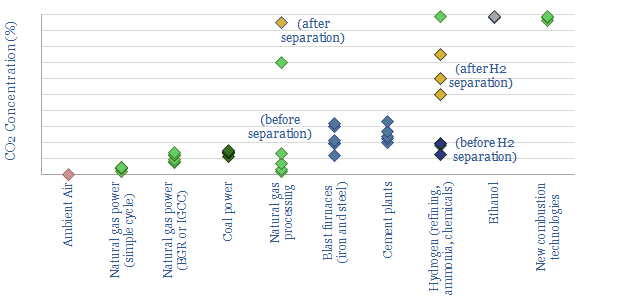
The aim of this data-file is to compile CO2 concentrations in industrial exhaust streams, as a molar percentage of flue gas. This matters for the costs of CO2 separation. Most promising CCS candidates are bio-ethanol plants, industrial hydrogen production and some gas processing, followed by cement and steel plants.
-
A breakdown of US energy consumption per person per year
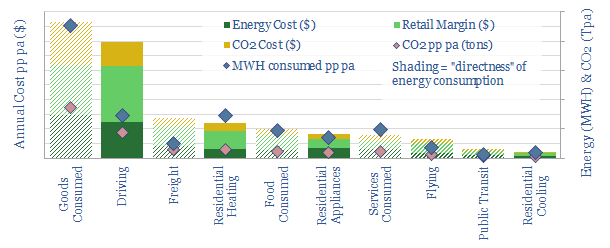
The average American consumes 36MWH of energy each year, emits 20 tons of CO2, spends $2,000 directly on energy (6% of income) and $4,500 including the energy embedded in goods and services (15% of income). A CO2 price of $75/ton may fully decarbonize the US but would absorb another 5% of average income.
-
Additive manufacturing: costs of 3D-printed products?
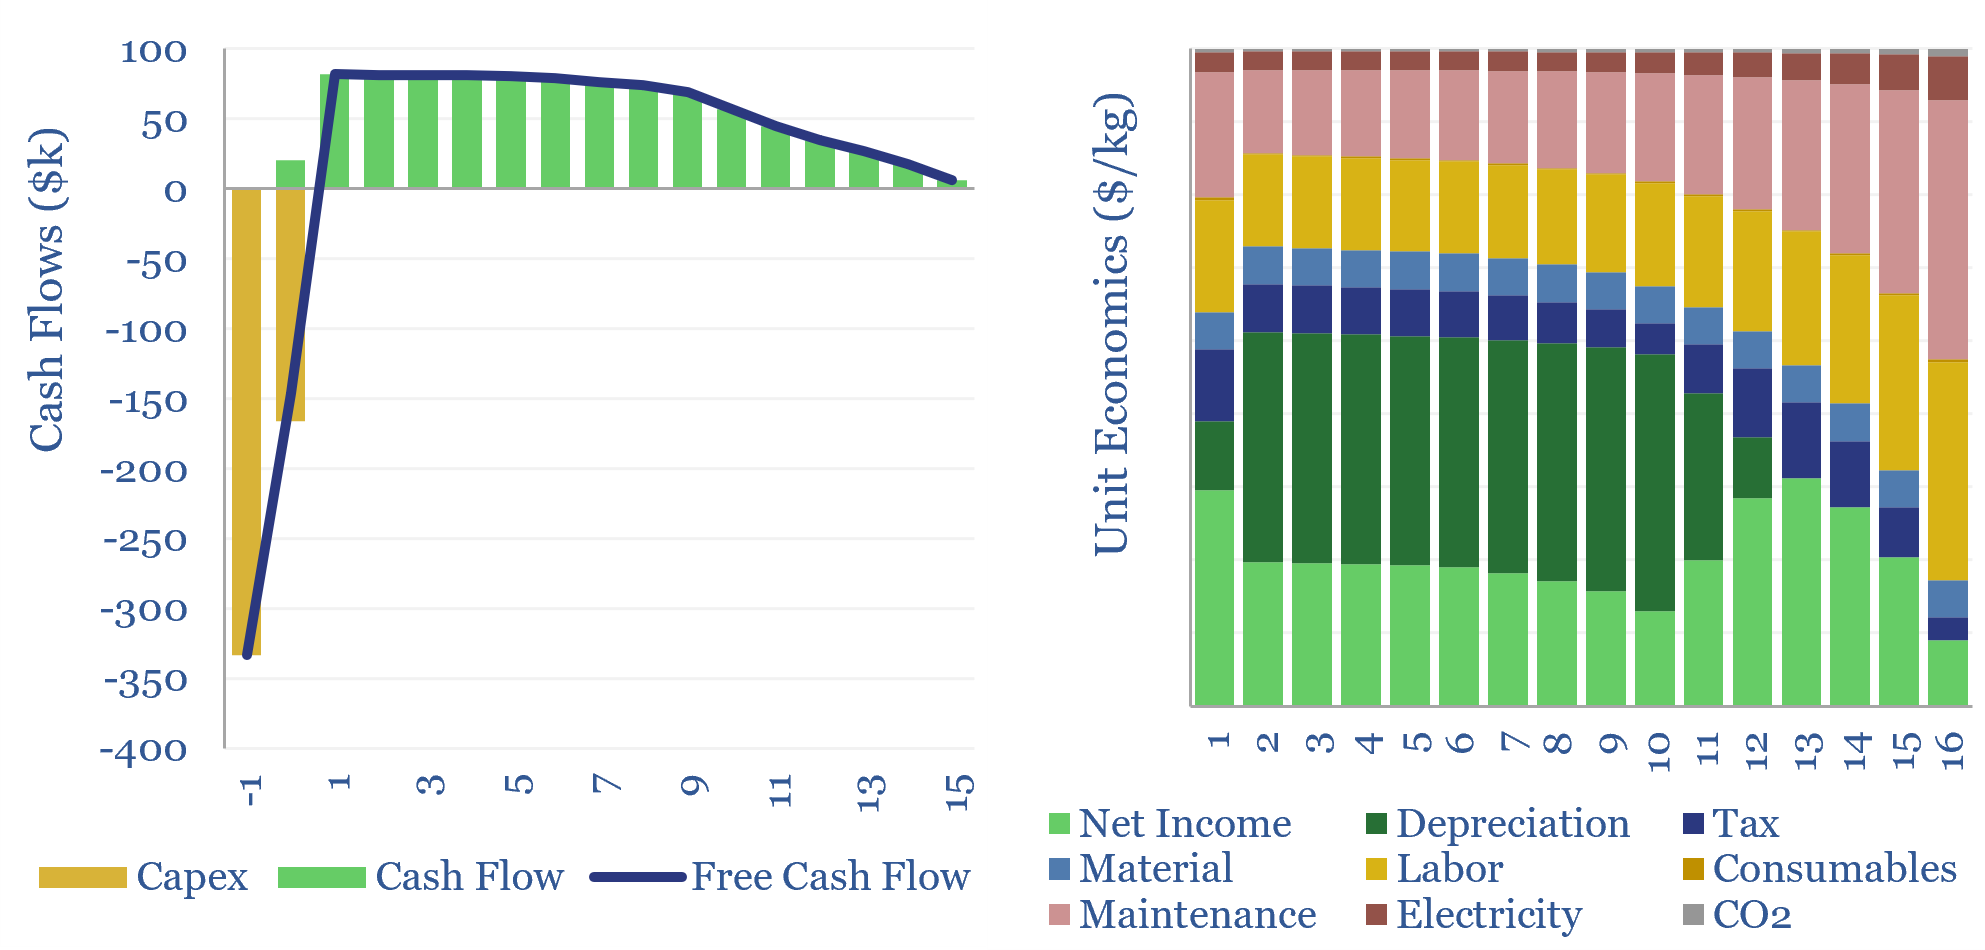
The costs of 3D printed products are estimated between $10-100/kg in this data-file, in order to earn a 10% IRR on constructing and running an additive manufacturing machine, net of labor costs, energy costs, maintenance and materials. Economic costs, energy intensity and CO2 intensity vary as a function of the material and can be stress-tested…
-
CO2-Cured Concrete: Solidia vs traditional cement?
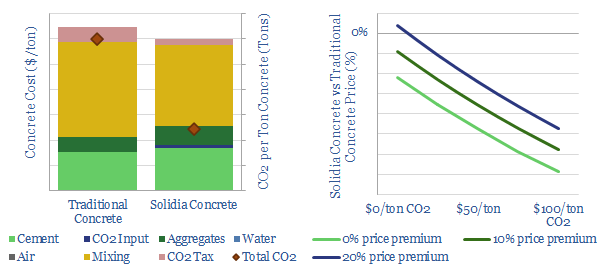
CO2-cured concrete has c60% lower emissions than traditional concrete, which is the most widely used construction material on the planet, comprising 4bn tons of annual CO2 emissions, or 8% of the global total. This data-file profiles the CO2 and economic costs of Solidia versus traditional cement, to size the opportunity.
-
US ethanol plants: what CO2 intensity?
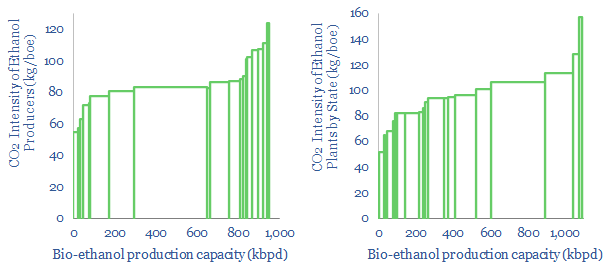
US bioethanol plants produce 1Mbpd of liquid fuels, with an average CO2 intensity of 85kg/boe. Overall, corn-based bioethanol has c40% lower CO2 than oil products. We screened the leaders and laggards by CO2-intensity, covering Poet, Valero, Great Plains, Koch, Marathon and White Energy.
Content by Category
- Batteries (96)
- Biofuels (44)
- Carbon Intensity (48)
- CCS (64)
- CO2 Removals (9)
- Coal (41)
- Commentary (65)
- Company Diligence (104)
- Data Models (922)
- Decarbonization (162)
- Demand (129)
- Digital (86)
- Downstream (47)
- Economic Model (221)
- Energy Efficiency (76)
- Hydrogen (63)
- Industry Data (308)
- LNG (56)
- Materials (86)
- Metals (88)
- Midstream (45)
- Natural Gas (161)
- Nature (76)
- Nuclear (28)
- Oil (176)
- Patents (39)
- Plastics (44)
- Power Grids (156)
- Renewables (153)
- Screen (137)
- Semiconductors (35)
- Shale (58)
- Solar (72)
- Supply-Demand (53)
- Vehicles (95)
- Video (24)
- Wind (47)
- Written Research (407)