Eaton is a power-electronics super-giant, listed in the US, employing 94,000 people, generating $27bn per annum of revenues and a market cap rocketing from $60bn in 2021 to $150bn in 2025. Large conglomerate companies can be opaque. The data-file is an Eaton revenue breakdown. We have aimed to guess how net sales are distributed across 200 different product categories.
All roads lead to power electronics. A finding across our research is that energy transition, as a theme, is going to be a kingmaker for power electronics, in order to integrate volatile wind and solar resources into grids, protect sensitive equipment and electrify more industrial and consumer processes.
We have written excitedly about power grid capex quadrupling to $1trn pa in the 2040s, with constructive thematic outlooks on power lines, industrial UPS, capacitor banks, variable frequency drives, transformers, power quality, next-gen switchgear and smart energy systems.
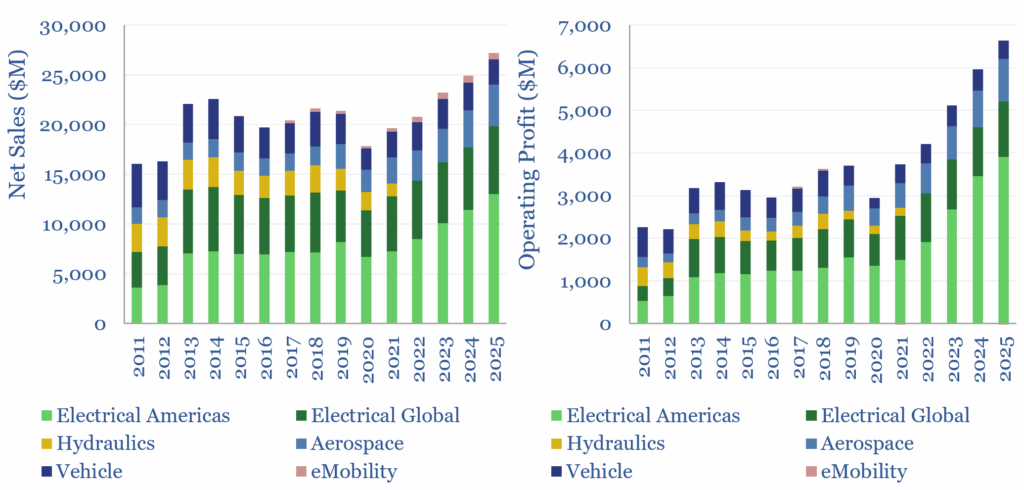
Eaton is increasingly focused on Power Electronics. Eaton’s revenue has shifted from 40% power-electronics in 2011-12 to 75% power-electronics in 2022 (chart below), especially after the company sold its hydraulics business to Danfoss in August-2021 for $3.3bn.
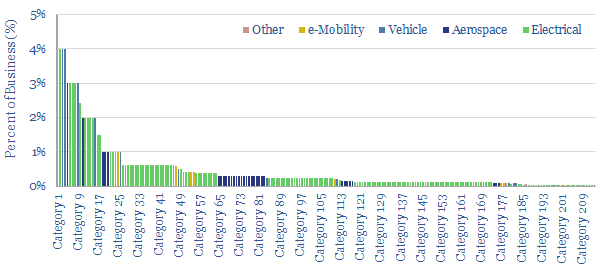
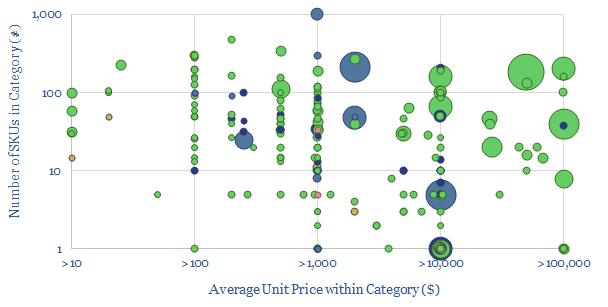
This data-file aims to break down Eaton’s revenues across product categories, using simple educated guesswork. The complexity is overwhelming (chart below). Eaton has over 10,000 SKUs, across 200 different categories. Its product split covers everything from electric vehicle charging, through to missile guidance systems, illuminated emergency exit signs and golf grips. Nevertheless, our breakdown does yield some conclusions.
Exposure to the energy transition. We think 25% of Eaton’s business is less directly exposed to the energy transition, albeit it is still important for the world to invest in aerospace & defence, and efficient vehicles. Another 25% of our Eaton revenue breakdown is exposed to themes with positive tailwinds in the energy transition. And the largest, c50% of the business is exposed to themes with very supportive tailwinds in the energy transition.
Disclaimer. In many cases, there is not much public information to go on. So this data-file is very much a case of educated guesswork, based on our understanding of what different product categories are, how big their market sizes are, and then juggling some plausible combinations of price x volume, estimated across each category.