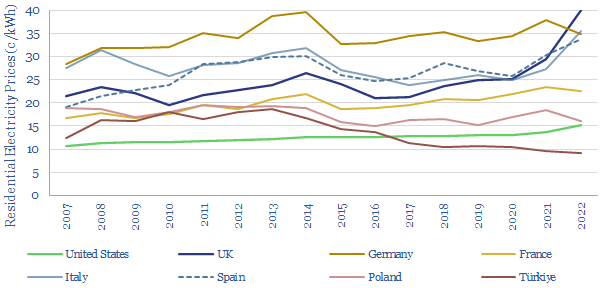
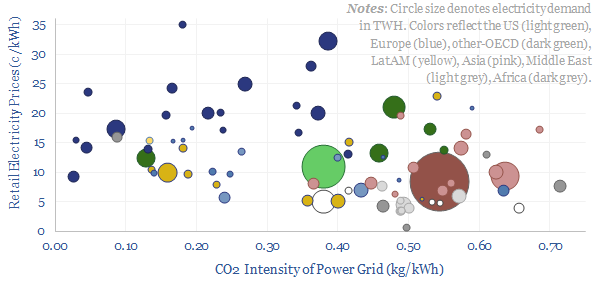
This data-file compares electricity prices (in c/kWh) vs power grids’ CO2 intensities (in kg/kWh), country-by-country. Retail electricity prices average 11c/kWh globally, of which 50-60% is wholesale power generation, 25-35% is transmission and 10-20% covers other administrative costs of utilities. The CO2 intensity of the global average power grid is 0.45 kg/kWh. Variations are wide. And there is a -35% correlation between electricity prices vs CO2 intensities in different countries globally.
Electricity Prices and CO2 Intensity Data
Retail electricity prices average 11c/kWh globally, across 28,500 TWH of global electricity demand in 2021, which is mostly composed of electricity consumption in 80 larger countries. The lower quartile is 7c/kWh and the upper quartile is 17c/kWh. The lower decile is 4c/kWh and the upper decile is 22c/kWh.
Some countries and regions do report retail, commercial and industrial electricity prices, such as the US EIA, Eurostat, or gov.uk, And we have aggregated some useful indices in our data-file. However, we think there are also data-challenges here.

Data challenges. Electricity prices are a minefield because they vary region-by-region within each country. They can also increasingly vary season-by-season, day-by-day or hour-by-hour. Prices for residential and commercial customers are usually around 2x higher than industrial customers. Tax regimes differ. There is often a ‘fixed charge’ plus a ‘variable tariff’, which means that total costs fall as usage rises. And finally, the end cost paid by consumers often reflects other variables such as their specific location and power factors.
We think the best data sources for electricity prices globally are therefore found via the tariffs actually charged to end customers. There are numerous price comparison websites that aggregate the data. For example, cable.co.uk is an excellent resource, comparing prices by country.
Good data on the CO2 intensity of different grids can also be found from sources such as Our World in Data. We have calculated CO2 intensity of different power grids directly, in other work, but for our cross-plot above, we want to avoid being accused of manipulating the data-sets, so we will take the average numbers from this independent resource. The average electricity generation globally has a CO2 intensity of 0.45 kg/kWh, with a lower quartile of 0.21 kg/kWh and upper quartile of 0.51 kg/kWh.
Correlation between electricity prices vs CO2 intensities?
Across our entire data-set, there is -35% correlation between retail electricity prices in different countries and their CO2 intensities. However, the correlation jumps to -50% if we exclude certain outliers.
Hydro-heavy countries. The global average is that 15% of all electricity in 2021 was generated from hydro. But four countries are unusual, because they generate the majority of their electricity from hydro, which has almost no embedded CO2 intensity. They are Norway (91% hydro), Canada (59%), Brazil (55%) and Sweden (45%). Electricity prices in these countries are just below the global average. Thus if we strip out these four countries from the analysis, then the correlation coefficient is -39%.
Nuclear-heavy countries. The global average is that 10% of all electricity in 2021 was generated from nuclear. But three countries are unusual, because they generate the majority of their electricity from nuclear, which has almost no embedded CO2 intensity. They are France (69%), Ukraine (55%) and Slovakia (52%). Remove these three countries as well, and the correlation coefficient is -41%.
Oil-heavy islands. Many islanded grids lack the size and scale for conventional power infrastructure, and thus rely heavily on diesel generators, with high costs above 20c/kWh and high CO2 intensity of 0.6 kg/kWh (data-file here). If we also exclude Caribbean Islands from our cross-plot, then the correlation coefficient is -45%.
Germany is another outlier on the chart. Its grid has the same CO2 intensity as Russia’s or Pakistan’s, yet its retail electricity prices are 5-7x higher. Or stated another way, Germany’s retail electricity prices are similar to Denmark’s — a nation that famously has the highest electricity prices at around 35c/kWh and the highest share of wind power of any country in the world at c50% — yet Germany’s CO2 intensity is over 2x higher. Remove Germany from our cross-plot, and the correlation coefficient is -46%.
Conclusions: what do the data mean?
We want to draw out important conclusions from our data-set. But we also want to do this objectively. There is no agenda. We are simply trying to interpret data here.
Our first interpretation is a simple rule-of-thumb. Energy prices get cheaper when countries invest in low-cost resources, especially domestic resources; while energy prices inflate when they cannot, or do not.
For example, the countries with the lowest cost electricity in the world, which is often below 6c/kWh on a fully-loaded retail basis, include OPEC countries running oil-heavy grids (e.g., Saudi Arabia, Kuwait, Libya), gas-rich countries running gas-heavy grids (Qatar, Russia, Algeria, Kazakhstan), and coal-rich countries running coal-heavy grids (e.g., Poland, South Africa).
Conversely, countries with the most expensive electricity seem to lack low-cost domestic resources, are highly reliant upon imports, or worse, have historically shut down low-cost domestic resources, and failed to invest enough in energy infrastructure.
Resist over-simplification. We often hear over-generalizations in energy, as though there will ultimately emerge “one energy source to rule them all”. This seems unlikely. The most economical energy sources very often depend upon context (note here).
Another interpretation is that countries with larger, more complex and more diversified energy systems tend to have higher electricity costs than countries that focus on simple domestic resources. This might seem surprising. But consider how ‘rate of return regulation’ works in the utility industry (note here). Consumers clearly have to pay more when a utility is earning 10% statutory returns on a large and low-utilization asset base, compared to a small and high-utilization asset base (power grid research here).
Generation opportunities? Generally, as global electricity prices are high, and there is reason to fear they may rise even further, some decision-makers may be increasingly interested in energy generation, or even self-generation to meet their own demand needs. This may augur favorable for rooftop solar, gas turbines, CHPs, storage or diesel gen-sets.
These interpretations also present a challenge in the energy transition, which is that price-sensitive countries may choose not to shut down low-cost but high-carbon domestic resources (coal deep-dive here). Hence, in turn, we expect more border tax adjustments to be introduced from countries seeking to encourage global decarbonization (note here).
We also remain worried about under-investment in energy (note here), resultant leakage of industrial activity to geographies with low energy prices (note here), or even outright backsliding in countries where energy prices become overly expensive (note here).
Our research remains focused on the best opportunities to achieve an energy transition. The best antidote to the challenges above will be if new technologies can lower the costs and expedite the deployment of wind, solar, power grids, efficiency, CCS and nature based solutions.

