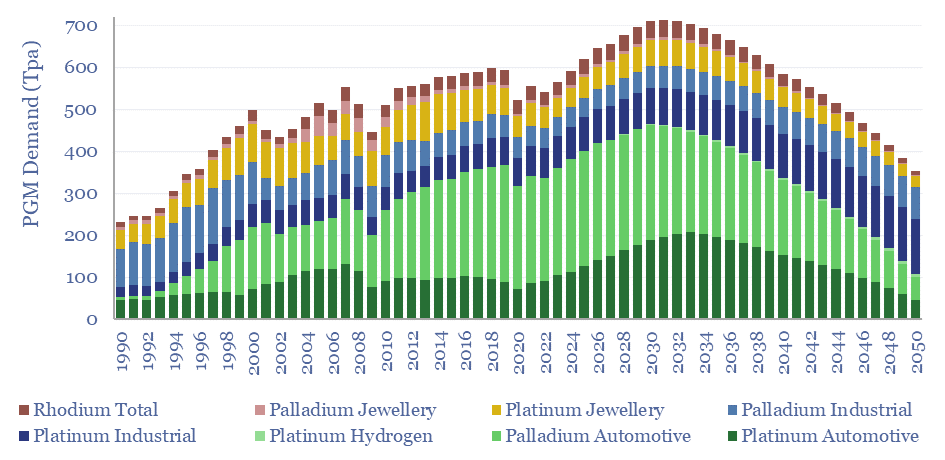
Core global PGM demand ran at 565 tons in 2023, which remains c6% lower than the all-time peak demand of 600Tpa in 2019. We model a recovery to 700 Tpa of demand for platinum, palladium and rhodium in 2030, then a long-run decline to 350Tpa if EVs ultimately reach 90% of vehicle sales by 2050. Numbers can be stress-tested in this model.
PGMs comprise six silver-white metals, which co-occur in nature and have remarkable catalytic properties: platinum, palladium, rhodium, ruthenium, iridium and osmium. They function as both oxidation and hydrogenation catalysts, conducting electricity, and adsorbing gases, such as oxygen and hydrogen.
Production is complex. 55% of global mined output is from South Africa and 25% is from Russia. Implats’s Rustenburg mine is 870m underground. Ore grades average 4 grams/ton, hence huge quantities of rock must be excavated, crushed, concentrated, smelted at 1,500ºC in electric arc furnaces, then electro-refined.
Therefore, the core global market for PGMs is defined by low volumes and very high prices, running at around $30bn pa, comprising 230Tpa of platinum at an average price of $30M/ton (aka $30/gram), 300Tpa of palladium at $45M/ton and 40kTpa of rhodium $230M/ton (see our commodity pricing database),
65% of the global market for PGMs is in catalytic converters, with another 10% used in jewelry, 8% in chemicals, 5% in electronics, 3% in glass, 3% in medical and about 1% in oil refining (especially catalytic reforming). These numbers are all broken down in the data-file.
Our outlook for PGM demand ramps back above 700Tpa by 2030, due to re-accelerating global vehicle sales, a slower acceleration of EVs in the mix due to affordability, and rising PGM loadings per vehicle.
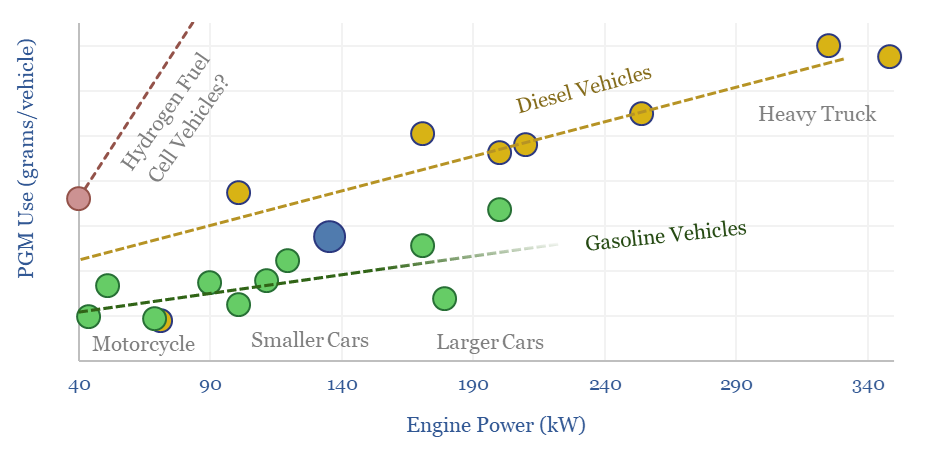
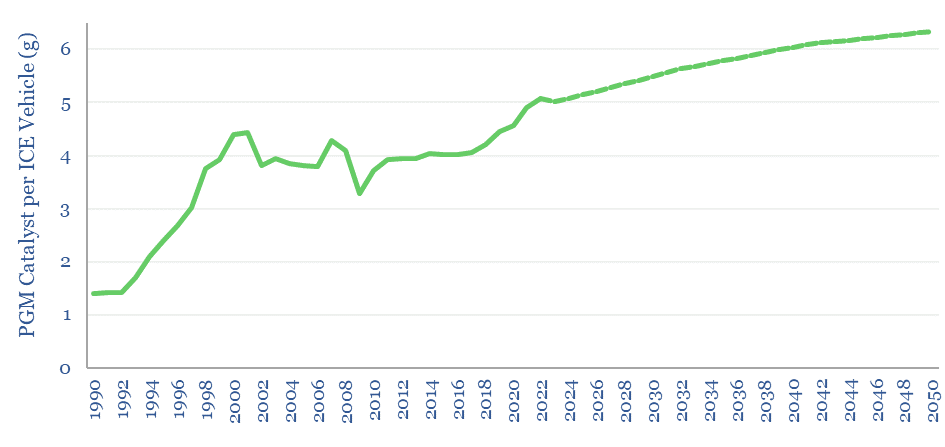
The catalyst loading per vehicle will continue rising, due to tightening emissions standards to improve air quality (especially in the emerging world). There are mix effects in the vehicle fleet, as heavy trucks burning diesel, but containing 3x more PGMs than gasoline cars, are slower to electrify. And efficient vehicle types such as hybrids and turbocharged engines require greater PGM loadings.
Numbers can be viewed and stress tested in the PGM_Demand tab. Underlying inputs and notes from technical papers are in the backup tabs.
In particular, we have compiled data into the PGM use of different vehicles, which rises as a direct function of their engine power, while for the same engine power, diesels tend to contain 2x more catalyst than gasoline vehicles, and hydrogen vehicles contain 4x more than diesels.