Global trade has been growing more adversarial. US foreign relations are also shifting. Hence this 16-page note maps 20 trade categories, across energy, materials and capital goods; in each case, breaking down global imports by source, and global exports by destination. Our top ten conclusions follow.
Global trade reached a new high of $33trn in 2024, which is equivalent to 30% of global GDP. Important numbers, including the largest net importers (e.g., the US) and net exporters (e.g., China) are tabulated on page 2.
However global trade has been growing more adversarial, including the spectre of tariffs, and shifting alliances/friendships between nations. Our goal in this note is to stay away from politics, and just help decision-makers understand global trade.
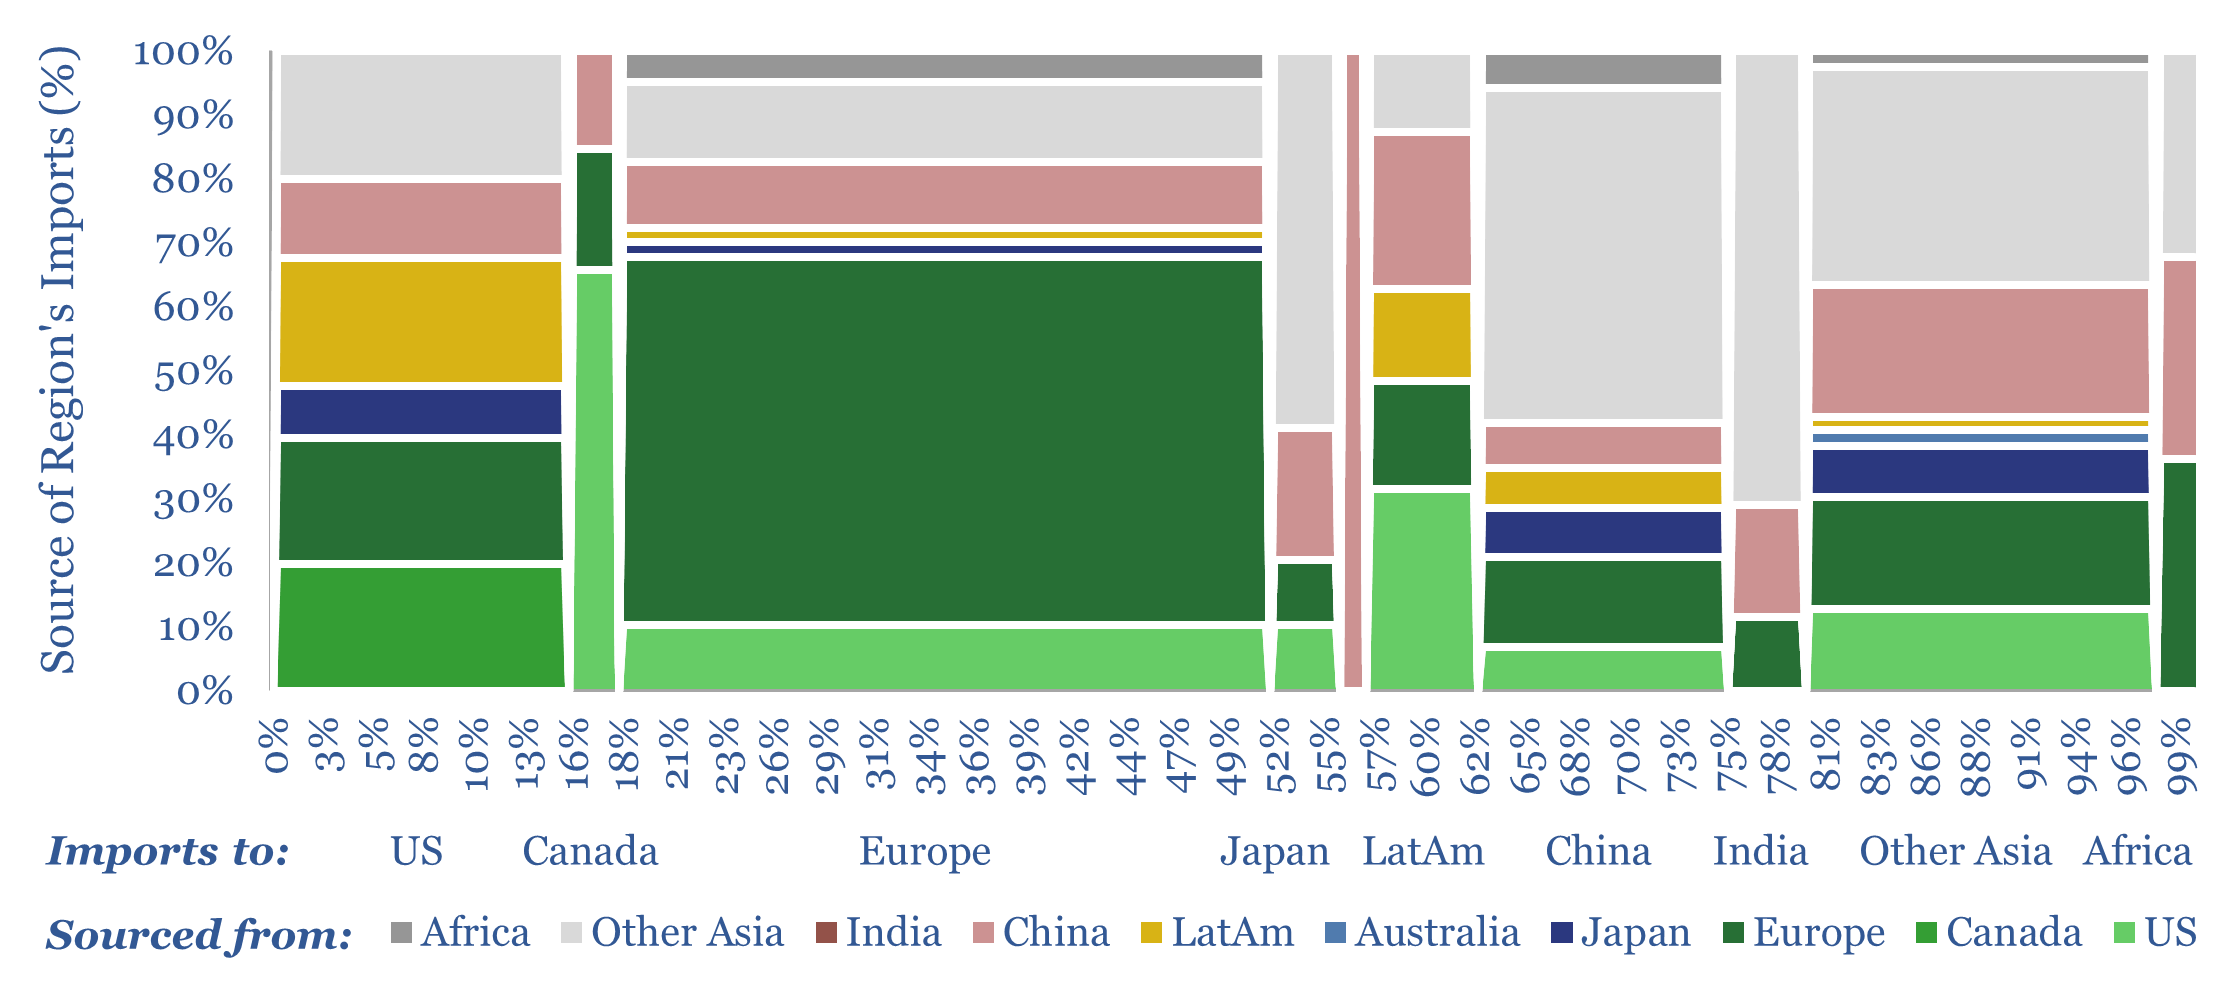
Hence we have assessed global trade by product by region, across twenty categories that matter in our research: things like LNG, solar modules, electric vehicles, gas turbines and large transformers. In each case, we produce a pair of charts, like the one above, mapping global imports and exports.
After reviewing the data, we do think there are good ways and bad ways to improve the US’s c$1trn pa trade deficit in goods. The best ways are to ramp up US oil and gas, value chains that benefit from these advantaged feedstocks, be perceived in a good light by trading partners, and continue innovating high-quality products.
There are global markets that are now dominated by Chinese suppliers, because China has low labor costs, policies that support industrial strength, and China has made enormous bets on emerging technologies (see lithium ion batteries or Rare Earth magnets on page 6, or electric vehicles on page 16).
In many value chains, however, we were surprised how much of China’s admittedly large output is simply dedicated to its own domestic market, how little is exported globally, and especially exported to the US (charts throughout the note).
We also find markets still dominated by US and European producers, because they have world-leading efficiency, quality and trustability (see gas turbines or aircraft on page 8). And because developed world nations would prefer to trade with ideologically aligned partners. If they are indeed still ideologically aligned?!
Tariffs seem misguided because (a) they are inflationary (b) they have not improved domestic production in the past but simply complexified imports (see solar modules on page 14) (c) US imports are already skewed towards friendly nations (see transformers on page 10) (d) aggressive trade policies risk turning friendly nations into less friendly nations, who may instead trade more with US competitors (see the example of LNG on page 11, or plastics on page 13).
In our outlook for 2025, we expressed fears that increasingly adversarial trade relations could cause inflation and/or a recession. Unfortunately, these fears are deepened by this review of global trade. We have also unlocked some new fears, e.g., about handing US market share to Asia, or imperilling the US LNG ramp.
We would be delighted if we were wrong. Meanwhile, we would also be delighted to help TSE clients navigate global trade data from Comtrade, using our various Excel templates: we can assess global trade across any of the ultra-granular sub-markets, and over time. So please do email if we can help you.