Global trade is set to hit a new peak of $33trn in 2024 (30% of global GDP), of which 70-80% is for goods and 20-30% is for services. This data-file disaggregates global trade by product by region, across c20 categories of energy, materials and capital goods, which we follow in our research, and which are worth about $7trn per year.
Global trade is increasingly important, as trade relations seem to be growing more adversarial and competitive, as discussed among our ten themes for energy and capital goods in 2025 and beyond. Hence the purpose of this data-file is to provide a snapshot of global trade by product by region, as it matters for energy, materials and capital goods categories in our research.
The data source for this analysis into global trade by product by region is the UN Comtrade database, which is freely available here. However it is possible to drown in this data source. What we have done in this data-file is to gather, clean, evaluate and present the data, in a standardized format.
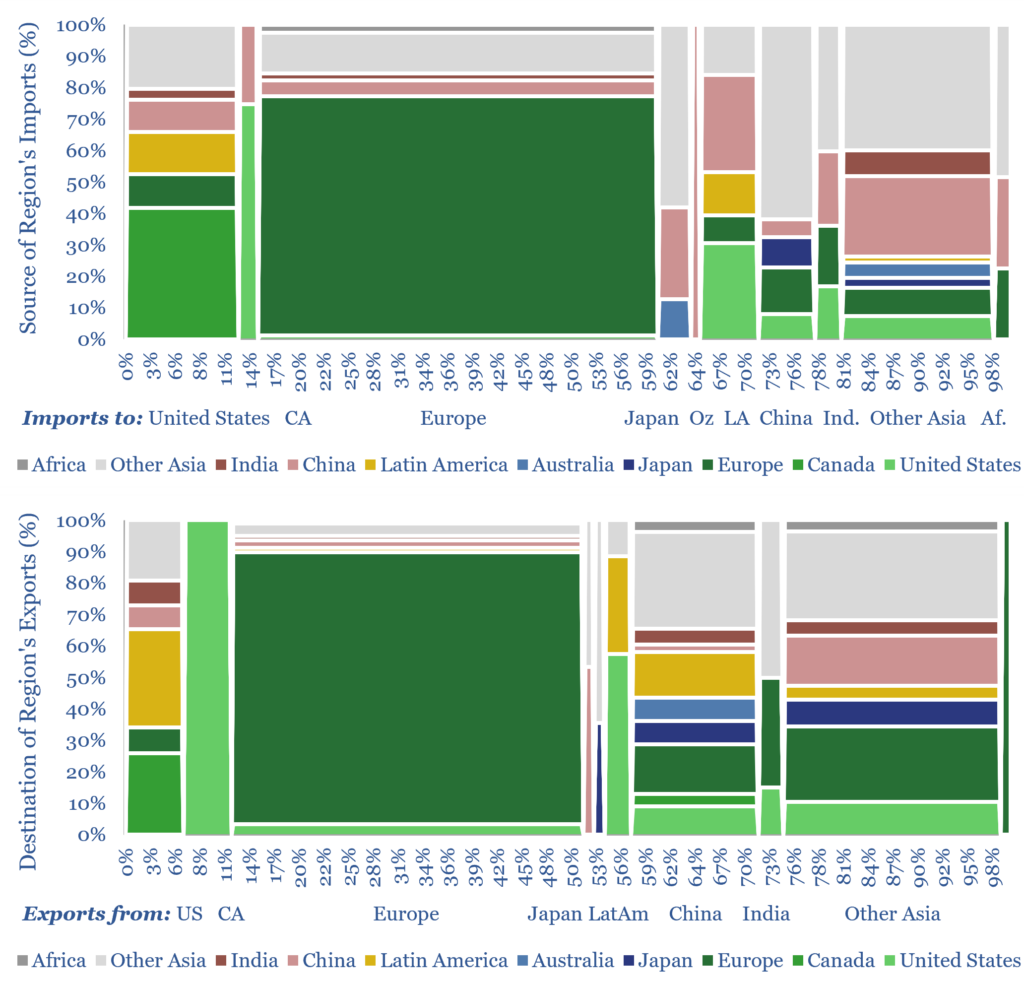
To provide a snapshot of global trade in each category, each tab of the data-file contains two marikmekko charts, showing the breakdown of global imports by region by source and the breakdown of global exports by region by destination. We also show the top 20 importers, top 20 exports (on both a gross and a net basis), and the top 100 import-export pairings, in each case.
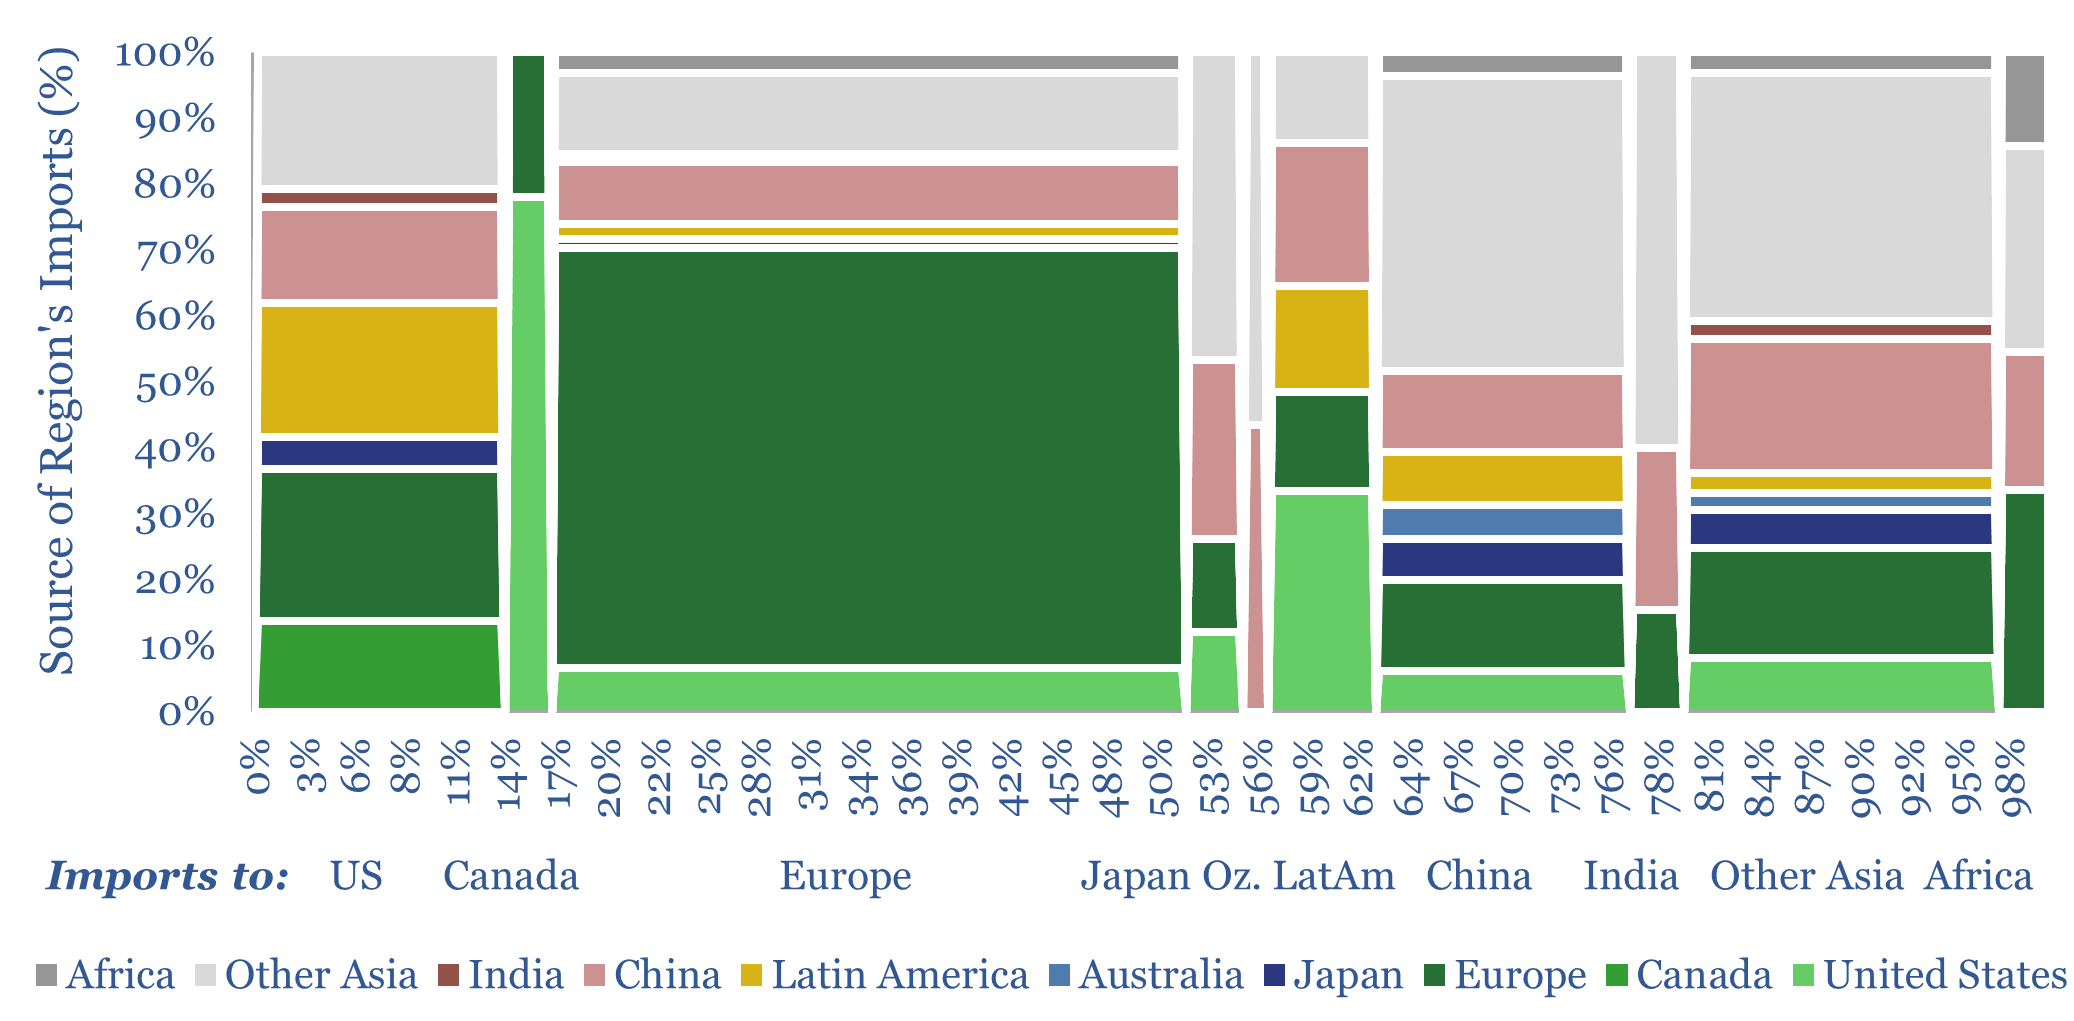
As an example, the two charts below illustrate the global market for aluminium, where around 70% of global supply is traded internationally, rather than supplied to a domestic market. The US is the largest net importer, sourcing c40% of its aluminium imports from Canada, and the remainder from other Asia, LatAm and Europe and China (first chart below). Canada exports all of its aluminium to the US presently (second chart below). China is the world’s largest net exporter, of which 30% goes to Other Asia, 15% to Europe and <10% to the US (second chart below).
Similar breakdowns are available for all of the other categories in this data-file, which include crude oil, LNG, solar PV modules, wind turbines, lithium ion batteries, autos, EVs, gas turbines, large transformers, other power electronics and MOSFETs, steel, aluminium, copper, lithium, plastic products, carbon fiber, permanent magnets, industrial machinery, aircrafts and some military expenditures.
Some of the trade patterns are particularly fascinating, which led us to write up our top ten insights into global trade. We can also use our data-pull templates to evaluate other markets for TSE clients, so please do write in with requests.