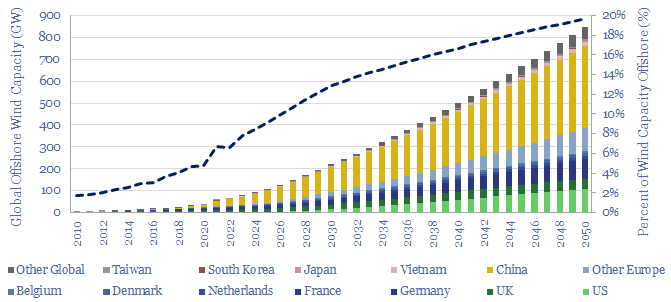
Global offshore wind capacity stood at 60GW at the end of 2022, rising at 8GW pa in the past half decade, comprising 7% of all global wind capacity, and led by China, the UK and Germany. Our forecasts see 220GW of global offshore wind capacity by 2030 and 850GW by 2050, which in turn requires a 15x expansion of this market.
Installed global offshore wind capacity stood at 60GW at the end of 2022, representing 7% of all global wind capacity installed to-date, based on helpful data from GWEC.
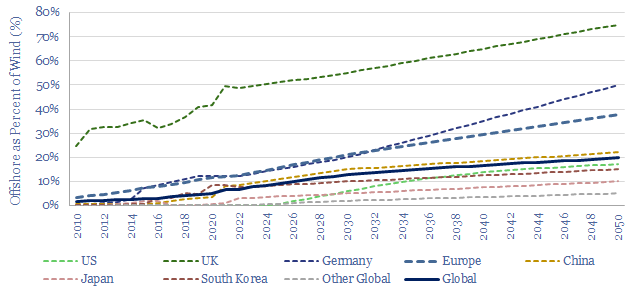
The largest offshore wind capacity bases among different countries are in China (31GW, meaning that 9% of China’s total wind capacity was offshore), the UK (14GW, 50% of total capacity is offshore) and Germany (8GW, 12% of total capacity is offshore).
Global offshore wind capacity forecasts by 2030 that have crossed our desk range from 200-400GW, and our own estimate is towards the lower end, at 220GW, which would be 13% of all global wind capacity.
Global offshore wind capacity forecasts by 2050 that have crossed our desk range from 600-2,000GW, and our own estimate is also towards the lower end, at 850GW, which would be 20% of all global wind capacity.
Please download the data-file to explore offshore wind capacity by country, and how the market might evolve. Our numbers are top-down estimates, approximations that seem reasonable to us, based on the size of the grid in each region, the share that can realistically come from wind, and the percent of wind that can realistically come from offshore, linking between various TSE energy market models.

Mathematically, if total installed wind capacity rises by 5x by 2050, and offshore’s share of that capacity rises 3x (from 7% to 20%) then offshore capacity is rising by about 15x, which is one of the larger ramp-ups required in our roadmap to net zero.
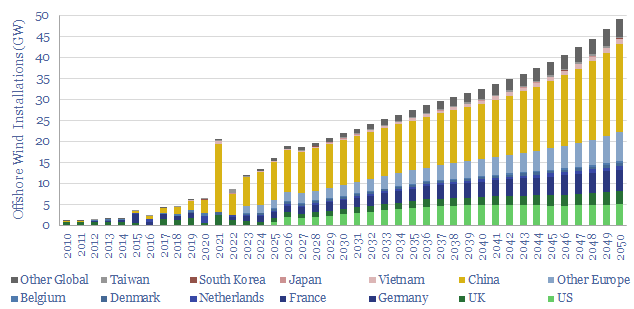
Offshore wind installations averaged 8GW per year in 2018-22, and must rise by 5x to 40GW per year in the 2040s (chart below).

Offshore wind capex requirements? At an average cost of $4,000-5,000/kW, this would require about $160-200 bn per year of capex, for comparison with other market sizes. For further details on our capex build-up, please see our offshore wind cost model.
Offshore wind generation in TWH? At an average capacity factor of 40% on installed capacity, the numbers in this data-file would translate into about 3,000 TWH of useful offshore wind energy, or 3% of the global total useful energy in our global energy demand models.
