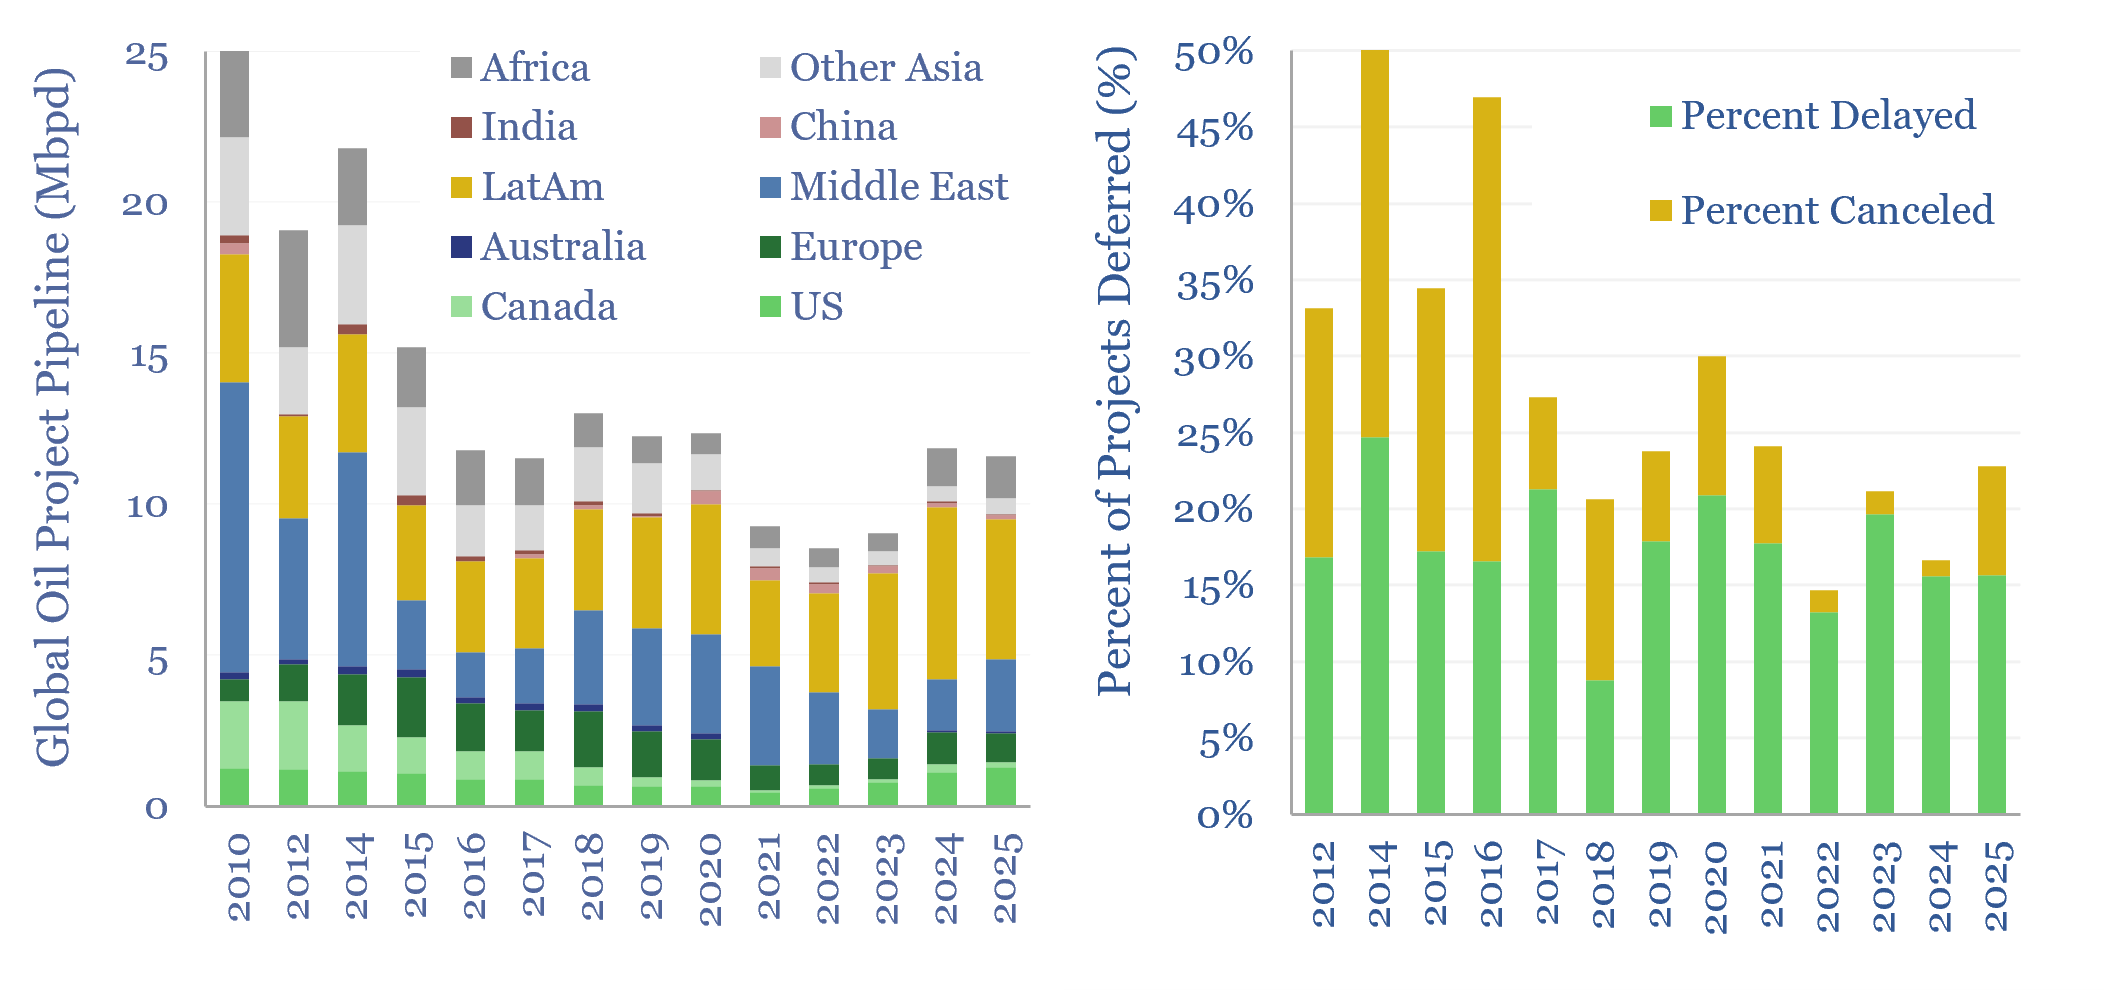
This data-file tracks conventional oil project developments, by region, by development type, and over time. Over 10Mbpd of conventional oil projects are currently under development in 2025, representing $500bn of capex. What does this mean for oil markets?
On average, 1.9Mbpd of new oil projects should be expected to start up and/or ramp up, each year in 2025-28, including over 2Mbpd of production gains in 2026, while the pace of development later tails back in 2028-30.

This is reminiscent of 2015, prior to the oil price collapse of 2015-16, when the total pipeline of conventional projects was only about 10% larger than it is today. And since 2014-15, we have lost visibility of major upcoming projects in Russia and Iran, which makes the numbers even closer.
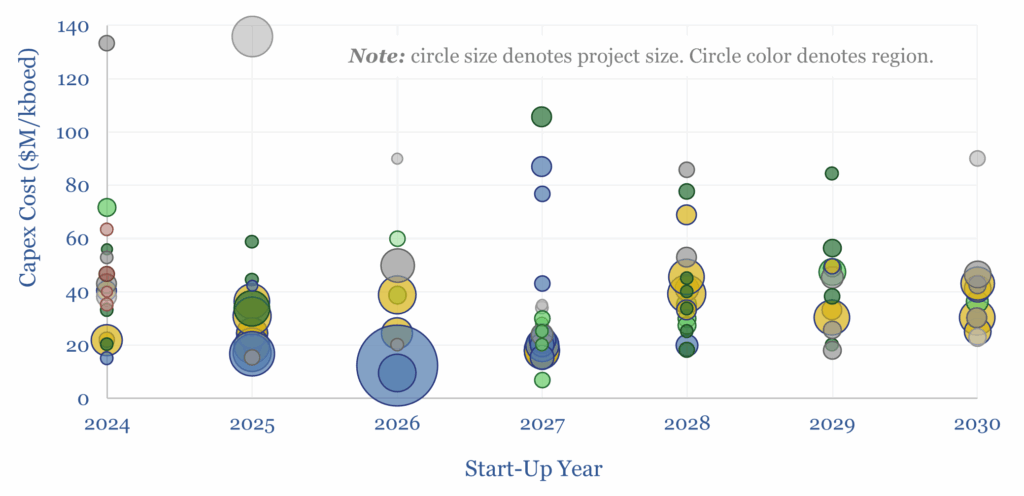
Breakevens on these oil project developments, in $/bbl terms, can very roughly be approximated by total development capex costs in $M/kboed. Where breakevens were quoted on projects in the pipeline, they tended to be below $40/bbl.
Capex costs for the average oil project in progress are $35M/kboed. 80% of the projects in progress have capex costs below $45M/kboed, and 90% are below $60M/kboed. So we might expect some projects to be delayed, but few will be canceled.
The conventional oil projects in progress are 10% onshore, 30% offshore and 60% deepwater, as measured by volume. Countries with the largest ramp-ups in progress include Brazil (2.9Mbpd), the US (1.3Mbpd), Saudi Arabia (1.2Mbpd), Guyana (1.1Mbpd) and the UAE (0.7Mbpd).
However, 17% of oil projects – one in six – incurred major delays each year, as defined by their projected start-up dates shifting backwards by over a year. And 9% of oil projects – one in ten – were canceled each year. The average delay rate is 35% of the original schedule, which implies a 1-year delay on the average project. The project pipeline is tracked over time in the data-file.
Global oil market balances are swayed by changes in global oil demand, start-ups of new projects, changes in unconventional production, existing fields’ decline rates, and disruptions due to geopolitical issues and voluntary cuts.