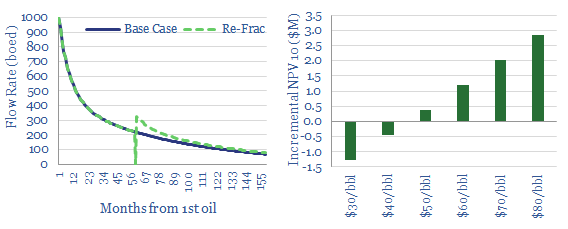
This model assesses the production-upliftsand well-level economicsof re-fracturing shale wells in the Permian and the Eagle Ford, to improve recovery of previously missed pay. The opportunity is interesting but not quite game-changing.
Economic breakevens are seen at c$45/bbl under our base-case assumptions. The most likely NPV uplift is c$0.5M/well. However higher prices and process-enhancements can unlock $2-3M of NPV10 per well.
Input assumptionsare informed by disclosures from Occidental and Devon Energy, the two E&Ps that dominate the technical literature. They are summarised in the ‘notes’ tab. Please download the file to stress-test the assumptions…
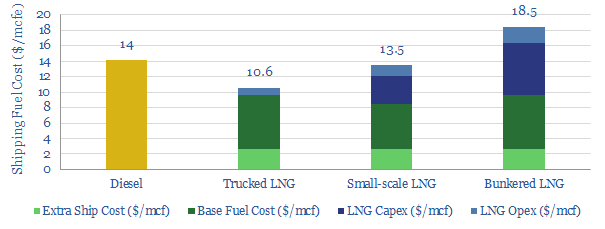
This model provides line-by-line cost estimates for LNG as a shipping fuel, compared against diesel. We used industry data and academic studies to estimate the all-in costs for (a) trucking LNG (b) small-scale LNG and (c) LNG bunkering, to supply a relatively fuel-intensive shipping route.
After IMO 2020 regulations buoy diesel pricing, it should be economical to fuel newbuild ships with small-scale LNG; and in the US it should be economical to convert pre-existing ships to run on small-scale LNG.
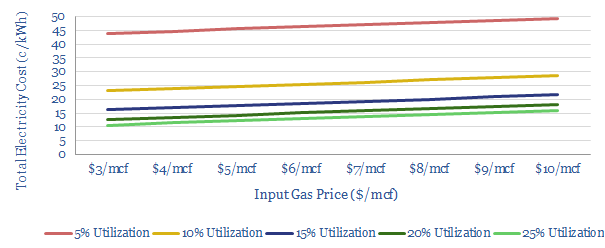
When electric vehicles are widespread, how will we fuel them? Our model shows the economics can be compelling for powering fast-chargers using gas turbines.
The electricity would cost 13c/kWh, at $3/mcf input gas (e.g., in the US), 20% utilisation of the infrastructure and a c7.5% pre-tax IRR.
Carbon emissionsare lowered by c70% compared to oil-fired vehicles. And the grid is spared the strain of sudden demand surges.
Is upside suggested for gas? Utilisation of the fast-charging infrastructure is much more important to the overall economics than the gas price. This means that greater EV adoption can accommodate considerably higher gas prices.
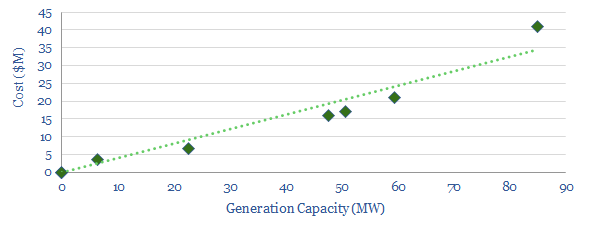
Our model is constructed as a sensitivity analysis, based on economic data from gas turbines (chart below), so you can flex the assumptions.
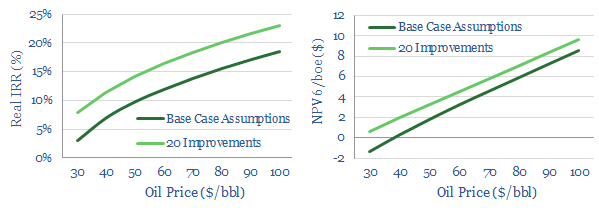
The appetite to invest in new offshore oil projects has been languishing, due to fears over the energy transition, a preference for share-buybacks, and intensifying competition from short-cycle shale. So can technology revive offshore and deep-water? This note outlines our ‘top twenty’ opportunities. They can double deep-water NPVs, add c4-5% to IRRs and improve oil price break-evens by $15-20/bbl.
This data-file quantifies the impact that technology can have on offshore economics. We start with a 250-line field model, for a typical offshore oil and gas project. We then list our “top twenty” offshore technologies, which can improve the economics. In a third tab, we update our base case model, line-by-line, to reflect these twenty technologies. Finally, the “before” and the “after” are compared and contrasted.
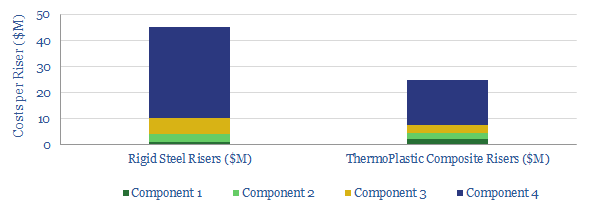
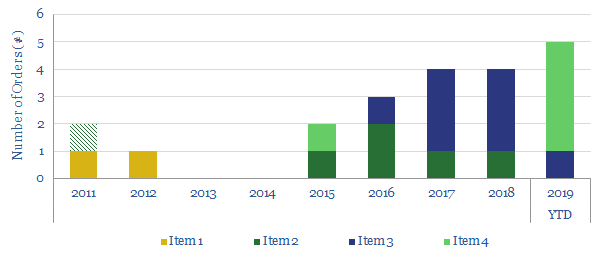
We have estimated the costs of a subsea riser system, for a typical deep-water project; and the potential cost-reduction that can be achieved by using ThermoPlastic Composite Pipe instead (e.g., Airborne, Magma). Savings should be around c45%, or c$20M/riser. Our data-file also includes the order-history to-date for TCP: by project, operator, and geography (below).
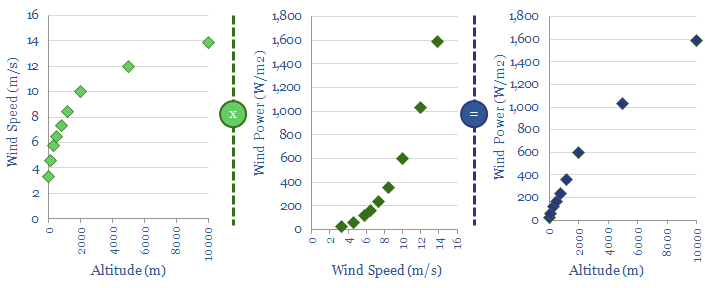
This data-file contains a simple model for how wind speeds and wind power co-vary with altitude. 2x greater power could likely be harnessed by a kite at 300m than a similar-sized turbine at 80m.
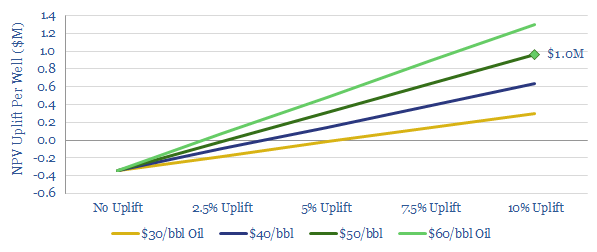
We have modelled the economic uplift of extra digital instrumentation on a typical Permian well. If the data can uplift production by 2.5%, then c$0.4M of instrumentation costs would “pay back” (i.e., break even). If the data can uplift production by 10%, it would add +$1M of NPV and +5% IRR per well. These numbers are all shown at $50/bbl, but you can flex the inputs in our model.
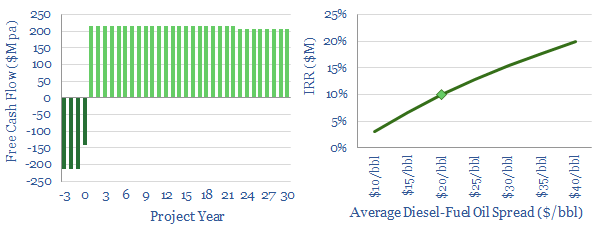
This data-file models the economics of Eni’s Slurry Technology, for hydro-converting heavy crudes and fuel oils into light products. It is among the top technologies we have reviewed for the arrival of IMO 2020 sulfur regulation, achieving >97% conversion of heavy fractions. The catalyst is stable and handles even ultra-heavy inputs. We see 10-20% IRRs at $20-40/bbl upgrading spreads. The data-file also summarises EST’s adoption in refineries to-date, future plans, and technical details of the EST process.
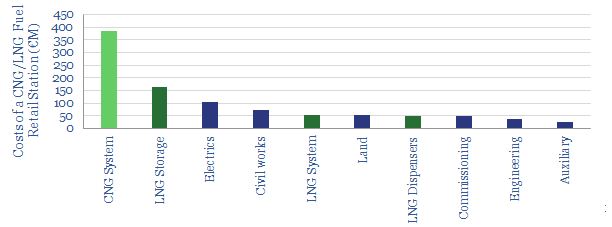
We have tabulated the costs of constructing an LNG-fuelling station for road vehicles across 55 distinct cost-lines, based on data from a dozen sites in Europe. Total capex will average €1M/site. Effectively, this is a $250/tpa re-gasification plant. Overall, we estimate distributing LNG to road-consumers will add $10/mcf to the costs of gas-fuel. Around 30% of the capex costs are specifically linked to LNG, and could be slim-lined for a CNG-only fuelling station.
Cookies?
This website uses necessary cookies. Our cookies are simply to improve your experience. We do not undertake any advertising or targeting via our cookies. By clicking 'accept' or continuing to use the website, you consent to our use of cookies.AcceptRead More
Privacy & Cookies Policy
Privacy Overview
This website uses cookies to improve your experience while you navigate through the website. Out of these, the cookies that are categorized as necessary are stored on your browser as they are essential for the working of basic functionalities of the website. We also use third-party cookies that help us analyze and understand how you use this website. These cookies will be stored in your browser only with your consent. You also have the option to opt-out of these cookies. But opting out of some of these cookies may affect your browsing experience.
Necessary cookies are absolutely essential for the website to function properly. This category only includes cookies that ensures basic functionalities and security features of the website. These cookies do not store any personal information.
Any cookies that may not be particularly necessary for the website to function and is used specifically to collect user personal data via analytics, ads, other embedded contents are termed as non-necessary cookies. It is mandatory to procure user consent prior to running these cookies on your website.