This data-file is an overview of different LNG liquefaction technologies: APCI, APX, Optimised Cascade, Fluid Cascade, DMR, SMR, PRICO and MMLS. A typical LNG liquefaction plant has energy intensity of 280kWh/ton, consuming 5% of the input gas entering the plant, with 20kg/boe of Scope 1&2 CO2 intensity. But efficient and electric-drive compression can lower these penalties by at least 50-75%.
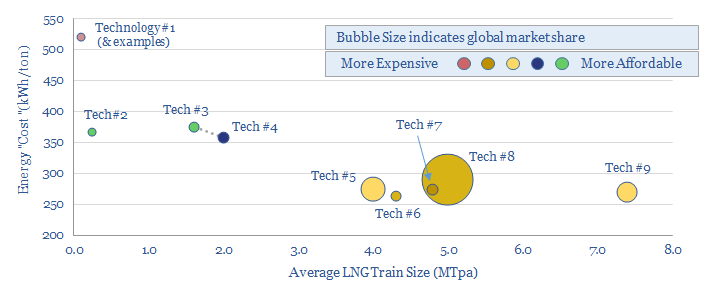
This data-file is an overview of LNG process technologies. For each one, we summarise how it works, advantages and disadvantages, typical train sizes, energy efficiencies, examples and involved-companies (e.g., Air Products, Bechtel, ExxonMobil, Conoco, Shell, Golar).
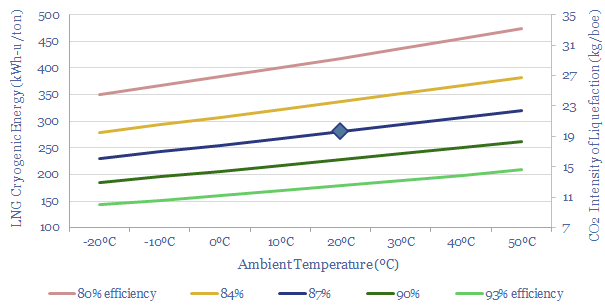
A typical LNG liquefaction plant has an energy intensity of 280kWh/ton of LNG, consuming 5% of the input gas entering the plant, with 20kg/boe of Scope 1&2 CO2 intensity. The energy economics are broken down in the ‘thermodynamics’ tab, using a simple model (chart below). But how is this affected by design decisions?
In an LNG plant, gas is first de-acidified to below 50 ppm, to remove contaminants such as CO2 in input gas which would otherwise be prone to freezing out during liquefaction. Then the gas is heat-exchanged with a cold refrigerant, reducing its temperature to -160C, producing liquid methane, which is 600x more dense than gaseous methane.
Coldness is generated in an LNG plant using the reverse Brayton cycle, as covered in our overview of cryogenics. A refrigerant is compressed. As gases are compressed, their pressure and temperature rise due to fundamental gas laws (PV = nRT). The excess temperature is rejected to the atmosphere via heat exchangers, yielding pressurized refrigerants at ambient temperature. Next, the refrigerant is expanded, which will cause it to cool via the Joule Thomson effect. I.e., as gases expand, they cool down. This coldness is then transferred into the methane via heat exchangers.
What refrigerants are used in LNG cycles? C3 Mixed Refrigerants are most common, for example in the APCI process. Blends vary. But generally, a cocktail of refrigerants will be more efficient than a single refrigerant, as different components improve heat transfer across different ranges of the temperature spectrum. One example of C3 mixed refrigerants for the APCI process includes 50% ethane, 27% methane, 20% propane, 2% butane, 1% nitrogen. The APX process adds a nitrogen loop.
What heat exchangers are used in LNG cycles? APCI and APX use spool-wound heat exchangers, which can be more efficient but more expensive than plate fin heat exchangers. Our model assumes 87% net efficiency transferring coldness from the refrigerant into the LNG stream.
What compressor turbines are used in LNG plants? First generation plants used steam turbines. Second generation plants used industrial gas turbines. Recent plants use aero-derivative turbines, which have smaller footprints, better efficiency and higher reliability. Nevertheless, please note that our ‘efficiency’ numbers above are shown on a useful energy basis within the plant, whereas the primary efficiency of single-shaft open-cycle industrial gas turbines can often be in the range of 25-30%, which is the main factor driving the high CO2 intensity charted above.
How do smaller-scale LNG projects differ? It is inherently harder to achieve high efficiencies at smaller LNG trains. They may use fewer and less optimized refrigerants. And a small cold box (lower volume to surface area) will leak coldness faster than a larger cold box (higher volume to surface area). So small trains can consume 50-100% more energy than large trains. This has historically been a challenge for LNG in transport.
How does FLNG differ? Space aboard an FLNG will always be at a premium. This favors more compact equipment. Lower exclusion distances might also confine the choice of refrigerants. The motion of the vessel does not help either. So again, we think FLNG can have 10-50% higher energy consumption versus large onshore LNG trains (more here).
Does temperature impact the CO2 intensity of LNG? Our thermodynamic model suggests that each 10ºC change in ambient temperature will impact the CO2 intensity of an LNG plant by around 10-15 kWh/ton (+/- 3-5%). Hence being situated in a cooler climate can be a mild advantage on energy efficiency and CO2 intensity.
Lowering the CO2 intensity? Large, efficient and well-optimized LNG plants will have lower energy use. But the clearest opportunity to lower Scope 1&2 CO2 intensity of an LNG plant is electrifying the compressors, and sourcing lower carbon electricity. Blending more wind, solar, nuclear or hydro into the plant’s electricity supply directly lowers Scope 1&2 CO2 intensity, often below 5-10 kg/boe.
e-drive LNG facilities are already in existence. Equinor’s Snohvit LNG started up in 2007, with the first e-drive system in the world, and what were at the time, the world’s largest high-voltage and high-speed synchronous motors, with 180MW total power rating, while a project launched by Equinor in 2022 will add a 420kV power line to supply this load from Norwegian hydro and reduce Norway’s total annual emissions by around 2% (press release here). Freeport LNG is the largest e-drive facility in the world, starting up in 2020, and each of 3 x 5MTpa trains uses a 75MW electric motor to drive its refrigeration compressors. Canada LNG and Woodfibre LNG are also pursuing e-drive (screen of LNG projects here).
Further details are in the data-file, including back-up calculations, and our overview of different LNG liquefaction technologies. We have also written a useful summary of key conclusions from our LNG research.