Solar insolation varies from 600-2,500 kWh/m2/year at different locations on Earth, depending on their latitude, altitude, cloudiness, panel tilt and azimuth. This means the economics of solar can also vary by a factor of 4x. Seasonality is a key challenge at higher latitudes. Active strategies are emerging for orienting solar modules.
1,353 W/m2 of solar energy arrives at the top of the Earth’s atmosphere, based on the Planck Equation, equivalent to almost 12,000 kWh/m2/year. Amazingly, solar is changing the world, even though only c2-3% of this energy is ultimately getting harnessed today.
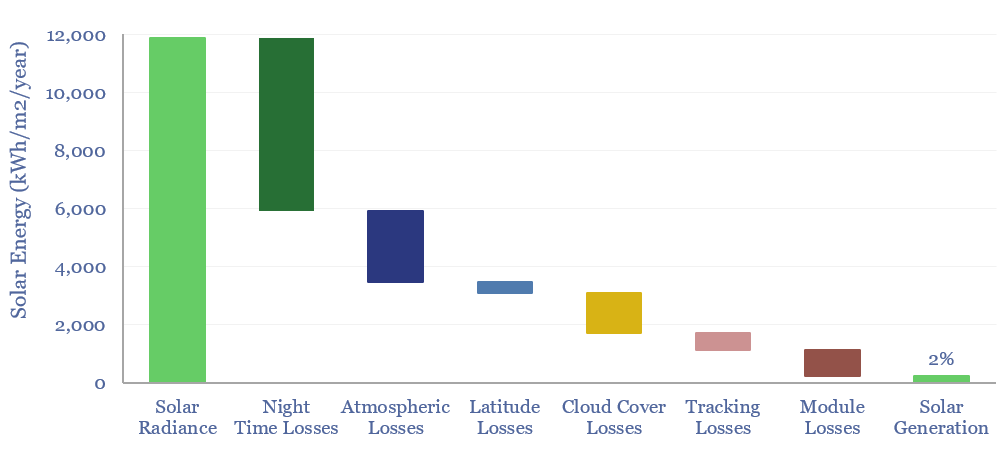
((The location of the losses in the chart above is also a reason for exploring solar in space, then beaming the power back to Earth)).
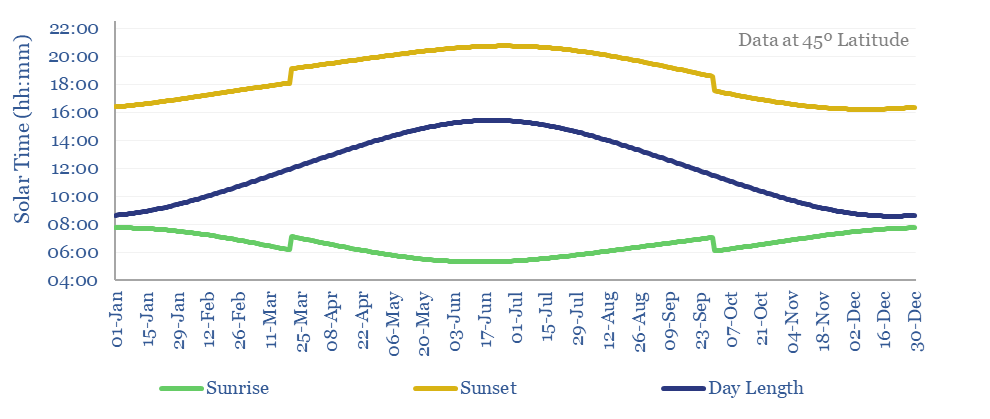
50% of all solar energy is inaccessible due to night time (chart below). Another 20-40% is inaccessible as it is absorbed by the atmosphere and clouds (depending on location). And of the insolation that does reach a solar module, only c20-25% is currently converted into useful electricity, in todays best HJT modules.
Calculating the insolation ultimately available for solar modules depends on the mass of atmosphere that is traversed by incoming sunshine, which varies hour-by-hour, with the elevation of the sun in the sky (i.e., vertical height) and its azimuth (i.e., compass point bearing).
Calculating these numbers is quite complex, because the Earth is 23º declinated on its axis. Hence the sun’s elevation and azimuth vary hour-by-hour, day-by-day and by location. Nevertheless, the charts below plot elevation and azimuth at a 45-degree latitude, based on 8,760 calculations throughout the year (24 hours per day x 365 days). The latitude can be varied in the data-file, which also contains hour-by-hour granularity.
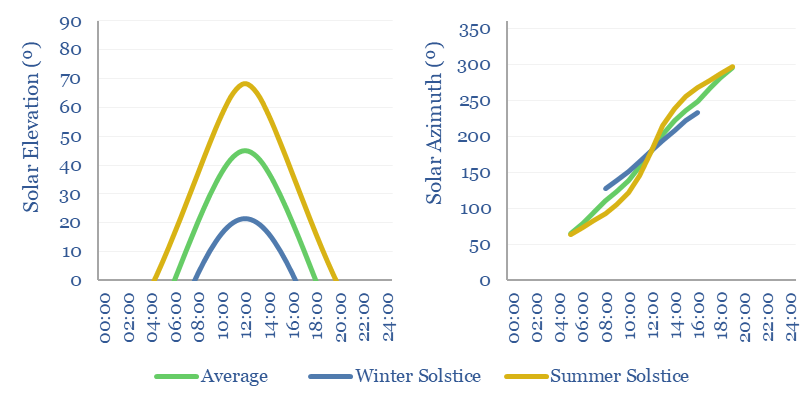
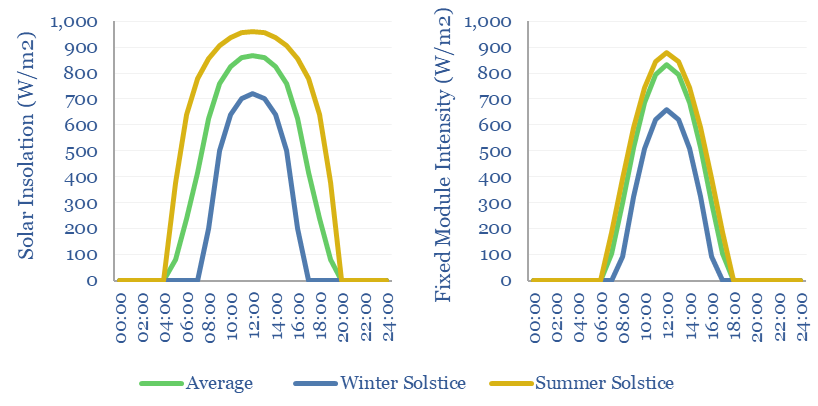
Insolation at ground level can thus be calculated, based on the mass of air that has been traversed (chart below left). However, fixed solar modules are not always pointed directly at the sun. This can sacrifice 30-60% of the maximum available insolation, simply due to misalignment (chart below right), which is also calculated hour by hour in the data-file.
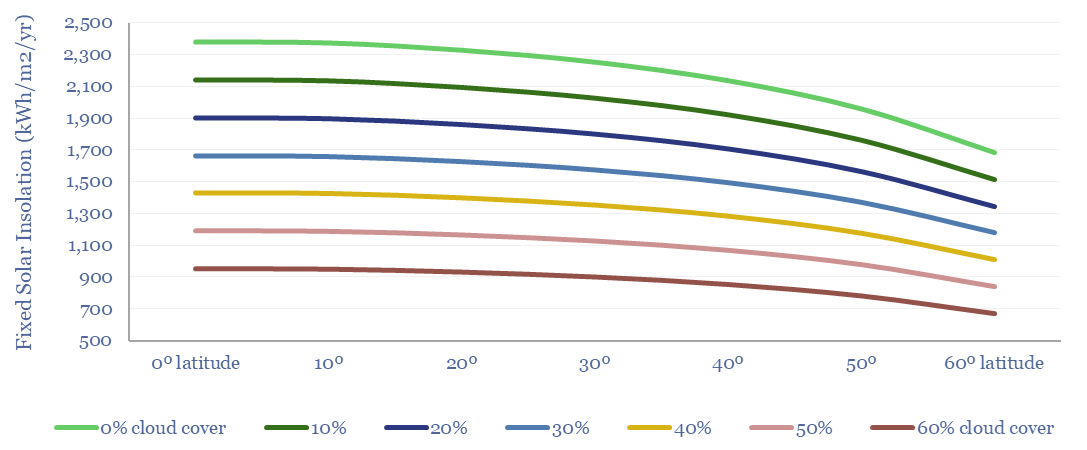
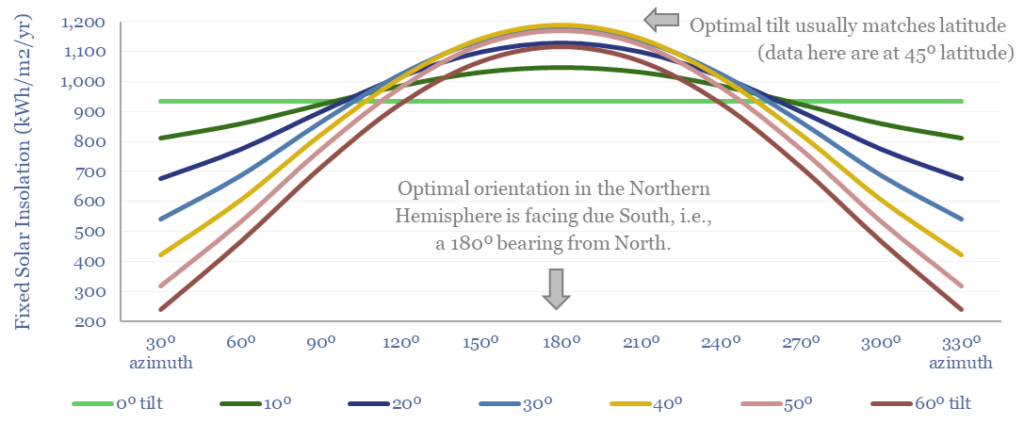
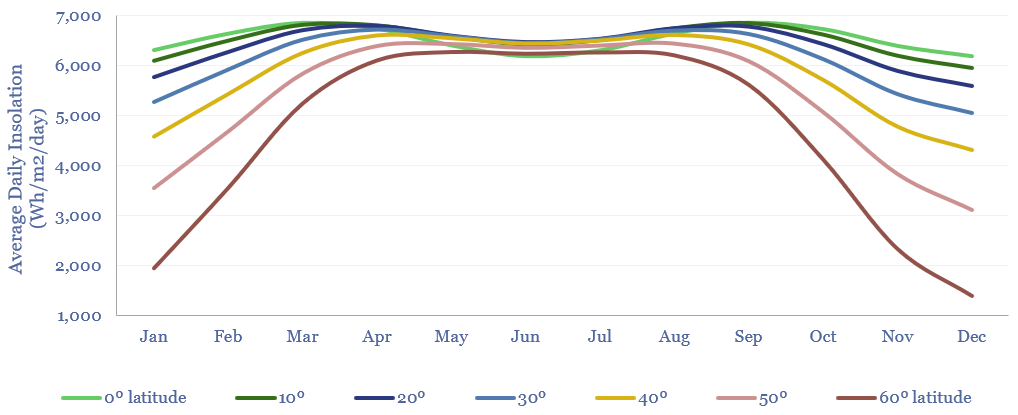
For fixed modules, losses can be minimized by matching the tilt of the panels to the latitude at which they are situated (chart below). The losses can be reduced even further with solar trackers, which rotate the panels to follow the sun, although this does also add cost.
It is usually best to orient solar modules directly South (in the North Hemisphere). But efficiency may be sacrificed for economics! West-facing panels generate one-third less energy than South-facing ones. But the generation profile is 2-4 hours later, to smooth out the duck curve.
Insolation available to solar modules can realistically vary from 700 – 2,400 kWh/m2/year, depending on latitude and cloudiness. These numbers can be stress-tested in the data-file.
Depending on latitude, generation will also be 0-80% lower in the winter versus the summer. This is visible in the charts above, as high latitudes have short days in the winter, while even when the sun is up, it is only sitting at a low angle in the sky. This seasonality is extremely challenging to back up economically using batteries.
The full data-file allows you to calculate solar insolation, and resultant solar generation, hour-by-hour and then on a fully annualized basis; by stress-testing latitude, elevation, module tilt, module azimuth, cloud cover, tracking efficiency and module efficiency. This is helpful for informing our solar economic models. The numbers match our findings from assessing real-world solar volatility. A fantastic resource that helped us with the equations is pveducation.org.