US Refinery Database: CO2 intensity by facility?

US refinery database

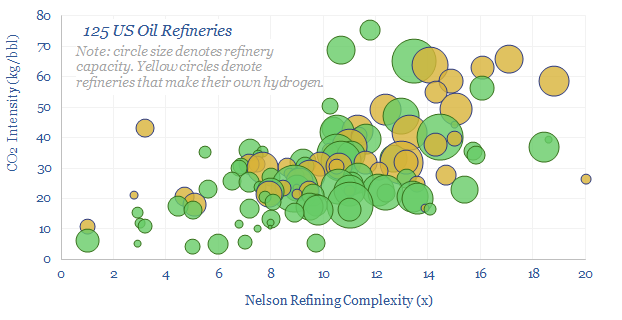
This US refinery database covers 125 US refining facilities, with an average capacity of 150kbpd, and an average CO2 intensity of 33 kg/bbl. Upper quartile performers emitted less than 20 kg/bbl, while lower quartile performers emitted over 40 kg/bbl. The goal of this refinery database is to disaggregate US refining CO2 intensity by company and by facility.


Every year, the c125 core refineries in the US, with c18Mbpd of throughput capacity report granular emissions data to the US EPA. The individual disclosures are something of a minefield, and annoyingly lagged. But this refinery database is our best attempt to tabulate them, clean the data and draw meaningful conclusions.

Some of the larger companies assessed in the data-file include Aramco, BP, Chevron, Citgo, Delek, ExxonMobil, Koch, HF Sinclair, Marathon, Phillips66, PBF, Shell and Valero.

The average US refinery emits 33kg of direct CO2 per barrel of throughputs, we estimate, with a 10x range running from sub-10 kg/bbl to around 100 kg/bbl (chart below).

US refinery database
125 US refineries ranked by CO2 intensity per barrel

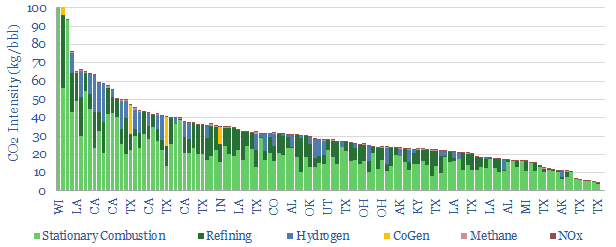
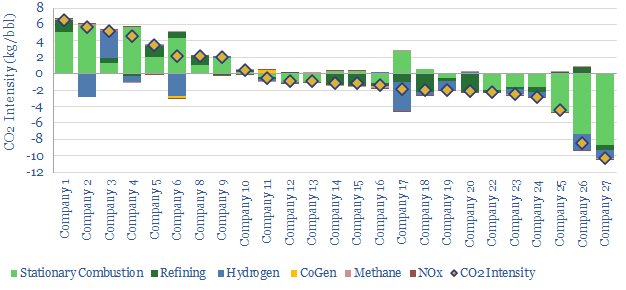
Breakdown of direct US refinery emissions? The 33 kg/bbl average CO2 intensity of US refineries comprises 20 kg/bbl of stationary combustion, 8 kg/bbl of other refining processes, 3 kg/bbl of on-site hydrogen generation, 1 kg/bbl of cogeneration, 0.2 kg/bbl associated with methane leaks.

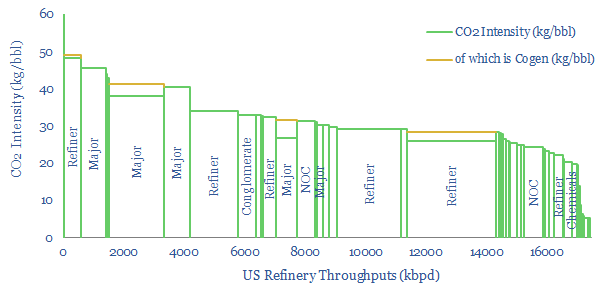
Some care is needed in interpreting the data. Refineries that are more complex, make cleaner fuels, make their own hydrogen (rather than buying merchant hydrogen) and also make petrochemicals are clearly going to have higher CO2 intensities than simple topping refineries. There is a 50% correlation between different refineries’ CO2 intensity (in kg/bbl) and their Nelson Complexity Index.

Correlation between the CO2 intensity of US refiners and their Nelson Complexity Index

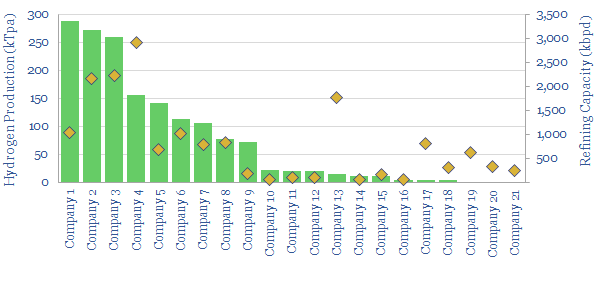
Which refiners make their own hydrogen versus purchasing merchant hydrogen from industrial gas companies? This question matters, as hydrogen value chains come into focus. Those who control the Steam Methane Reformers may be readily able to capture CO2 in order to earn $85/ton cash incentives under the IRA’s reformed 45Q program, as discussed in our recent research note into SMRs vs ATRs. One SuperMajor and two pure play refiners stand out as major hydrogen producers, each generating 250-300kTpa of H2.

US refinery database
Which refiners make their own hydrogen versus purchasing merchant hydrogen

How has the CO2 intensity of US refineries changed over the past 3-years? The overall CO2 intensity is unchanged. However, some of the most improved refineries have lowered their CO2 intensities by 2-10 kg/bbl (chart below). Conversely, some Majors have seen their CO2 intensities rise by 2-7 kg/bbl.

US refinery database
Change-in-CO2-intensity-of-different-US-refiners-over-time

For further context and ideas, we have also published summaries of our key conclusions into downstream, vehicles and long-term oil demand. All of our hydrocarbon research is summarized here.

The full refinery database contains a granular breakdown, facility-by-facility, showing each refinery, its owner, its capacity, throughput, utilisation rate and CO2 emissions across six categories: combustion, refining, hydrogen, CoGen, methane emissions and NOx (chart below). The data-file was last updated in 2023 and covers the full US refinery landscape in 2018, 2019 and 2021, going facility by facility, and operator by operator.

Ventures for an Energy Transition?

Oil Major Venture Investments

This database tabulates almost 300 venture investments made by 9 of the leading Oil Majors, as the energy industry advances and transitions.


The largest portion of activity is now aimed at incubating New Energy technologies (c50% of the investments), as might be expected. Conversely, when we first created the data-file, in early-2019, the lion’s share of historical investments were in upstream technologies (c40% of the total). The investments are also highly digital (c40% of the total).

Four Oil Majors are incubating capabilities in new energies, as the energy system evolves. We are impressed by the opportunities they have accessed. Venturing is likely the right model to create most value in this fast-evolving space.

The full database shows which topic areas are most actively targeted by the Majors’ venturing, broken down across 25 sub-categories, including by company. We also chart which companies have gained stakes in the most interesting start-ups.

Overview of Downstream Catalyst Companies

Companies in Refining Catalysts

This data-file tabulates details of the c35 companies commercialising catalysts for the refining industry.  Improved catalysts are aimed at better yields, efficiencies and energy intensities. This is the leading route we can find to lower refining sector CO2 emissions.

In particular, we find five early-stage companies are aiming to commercialise next-generation refining catalysts.

We also quantify which Majors have recently filed the most patents to improve downstream catalysts.

If you would like us to expand the data-file, or provide further details on any specific companies, then please let us know…

At the cutting edge of EOR?

Leading Oil Majors in EOR

This data-file summarises 120 patents into Enhanced Oil Recovery, filed by the leading Oil Majors in 2018. Based on the data, we identify the “top five companies” and what they are doing at the cutting edge of EOR.

We find clear leaders for water-flooding both carbonate and sandstone reservoirs. At mature fields, we think these operators may be able to derive >10pp higher recovery factors; and by extension, lower decline rates, higher cash flows and higher margins.

As more of the world’s oilfields age, having an “edge” in EOR technology will make particular Oil Majors more desirable operators and partners, to avoid the higher costs and CO2 intensities of developing new fields to replace them.


Make CO2 into valuable products?

Make CO2 into valuable products

This data-file is a screen of 27 companies, which are turning CO2 into valuable products, such as next-generation plastics, foams, concretes, specialty chemicals and agricultural products.


For each company, we have assessed the commercial potential, technical readiness, partners, size, geography and other key parameters. 13 companies have very strong commercial potential. 10 concepts are technically ready (up from 8 as assessed in mid-2019),  6 are near-commercial (up from 5 in mid-2019), while 13 are earlier-stage.

A detailed breakdown is also provided for the opportunity to use CO2 enhancing the yields of commercial greenhouses (chart below).

The featured companies include c21 start-ups. But leading listed companies include BP (as a venture partner), Chevron Phillips, Covestro, Repsol, Shell, TOTAL (as a venture partner) and Saudi Aramco.

Offshore Capex for Technology Leaders?

offshore capex for technology leaders

Technology leadership determines offshore capex. Specifically, this data-file measures a -88% correlation coefficient between different Major’s offshore patent filings in 2018 and their projects’ capex costs.


The details: We have tabulated the number of Offshore Patents filed in 2018, across 25 leading Majors, from our sample of 3,000 patents. We have also tabulated a dozen, recent, offshore greenfields operated by these companies, which were sanctioned in 2017-19. Investments from Aramco, BP, Equinor, Exxon, Petrobras, TOTAL and Shell are included.

The lowest-cost  projects are not “easy oil”. The most economical project in the entire sample, at $17M/kboed, has a complex gas cap with a risk of asphaltene precipitation.  Also in the ‘Top 5’ are an Arctic greenfield, an ultra-deepwater carbonate with unusually high-CO2 and an ultra-high pressure deep-water field. Economical development depends on leading technology.

To see the projects included in the analysis, please download the data-file…

Major technologies to decarbonise power?

leading oil companies for decarbonising the energy system

Leading Oil Majors will play a crucial role in decarbonising the energy system. Their initiatives should therefore be encouraged by policy-makers and ESG investors, particularly where new energy technologies are being developed, which will unlock further economic opportunities to accelerate the transition.

In order to help identify the leading companies, this-data file summarises c90 patents for de-carbonising power-generation. It is drawn from our database of over 3,000 distinct patents filed by the largest energy companies in 2018. These technologies will secure the role of fossil fuels, particularly natural gas, in a decarbonising energy system.

De-carbonising carbon?

De-Carbonising Carbon

Decarbonisation is often taken to mean the end of fossil fuels. But it could become more feasible simply to de-carbonise fossil fuels. This 19-page note explores two top opportunities: next-generation combustion technologies, which can meet the world’s energy needs relatively seamlessly, with zero carbon and little incremental cost. They are ‘Oxy-Combustion’ using the Allam Cycle and Chemical Looping Combustion. Leading Oil Majors support these solutions to create value advancing the energy transition.

Inflow Control: Our Top 20 Papers from 2019

digital technology to optimise horizontal wells

This data-file summarises twenty recent papers using inflow control devices: an exciting digital technology to optimise horizontal wells by limiting production from zones that are susceptible to flowing water or gas.


To lower global decline-rates, adoption is increasingly widespread at horizontal wells around the conventional oil industry. Described operators include Aker-BP, CNOOC, Equinor, KOC, Lukoil, Mubadala, OMV, PetroChina, Rosneft, Aramco, Schlumberger, Suncor and pure-play Tendeka.

Each paper is categorized by company, by country, specific fields (if relevant), paper-type, focus, well-type, ICD-type, our assessed “impact” and a short summary.

Our “Top 10 facts” on ICDs are also summarised in the data-file…

Shale: Upgrade to Fiber?

DAS Quest for Idealized Completion

Completing a shale well depends on over 40 variables. Each one can be optimised using data. It follows that next-generation data could deliver next-generation shale productivity.

This note focuses on the most exciting new data methodology we have seen across the entire shale space: distributed acoustic sensing (DAS) using fiber-optic cables. It has now reached critical mass.

DAS will have six transformational effects on the shale industry. Leading operators and service companies are also assessed.

Copyright: Thunder Said Energy, 2019-2024.