CCS
-
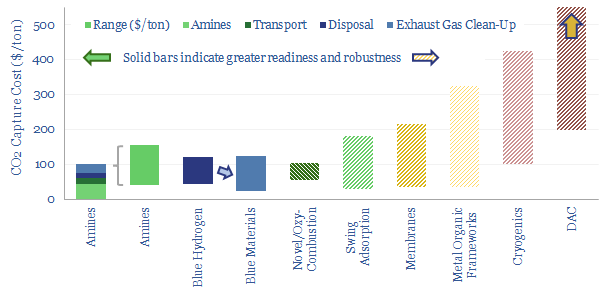
Carbon capture and storage: research conclusions?

Carbon capture and storage (CCS) prevents CO2 from entering the atmosphere. Options include the amine process, blue hydrogen, novel combustion technologies and cutting edge sorbents and membranes. Total CCS costs range from $80-130/ton, while blue value chains seem to be accelerating rapidly in the US. This article summarizes the top conclusions from our carbon capture…
-
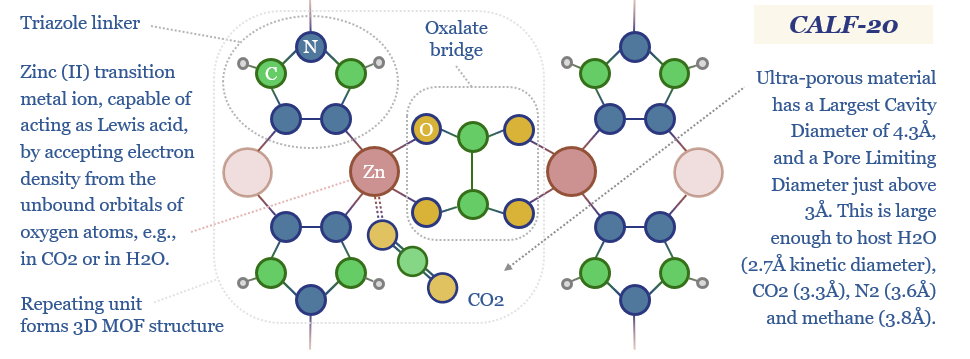
Metal Organic Frameworks: sorting hat?

Metal Organic Frameworks (MOFs) are a game-changer for industrial separation, which consumes c10% of global energy. Activity is surging. This 18-page report reviews MOFs’ recent progress and future promise. As a case study, CALF-20 can deflate CCS costs by c50%, per Svante’s TSA process.
-
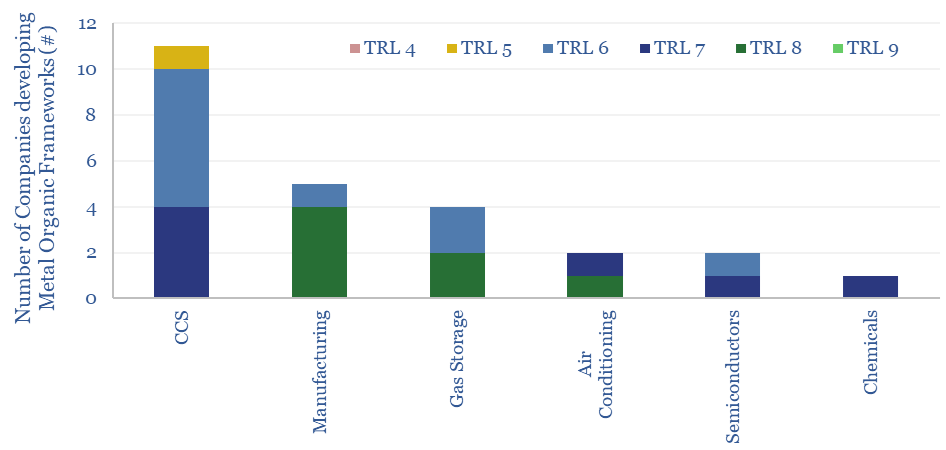
Metal organic frameworks: challenges and opportunities?

Metal organic frameworks (MOFs) are an exciting class of materials, which could reduce the energy penalties of CO2-separation by c80%, and reduce the cost of carbon capture to $20-40. This data-file screens companies developing metal organic frameworks, where activity has been accelerating rapidly, especially for CCS applications.
-
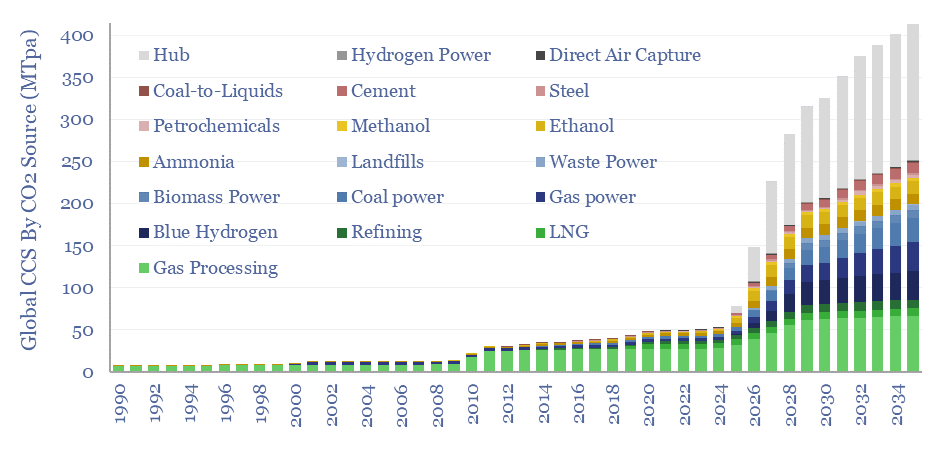
Global CCS Projects Database

Over 400 CCS projects are tracked in our global CCS projects database. The average project is 2MTpa in size, with capex of $600/Tpa, underpinning over 400MTpa of risked global CCS by 2035, up 10x from 2019 levels. The largest CO2 sources are hubs, gas processing, blue hydrogen, gas power and coal power. The most active…
-
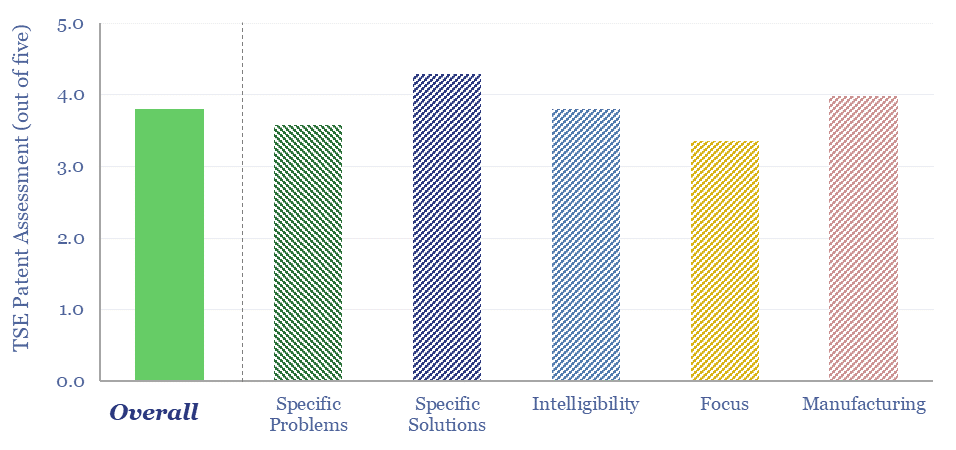
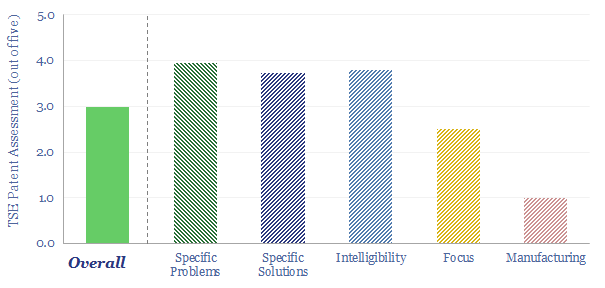
BrightLoop: clean hydrogen breakthrough?

Is Babcock and Wilcox’s BrightLoop technology a game-changer for producing low-carbon hydrogen from solid fuels, while also releasing a pure stream of CO2 for CCS? Conclusions and deep-dive details are covered in this data-file, allowing us to guess at BrightLoop’s energy efficiency and a moat around Babcock’s reactor designs?
-
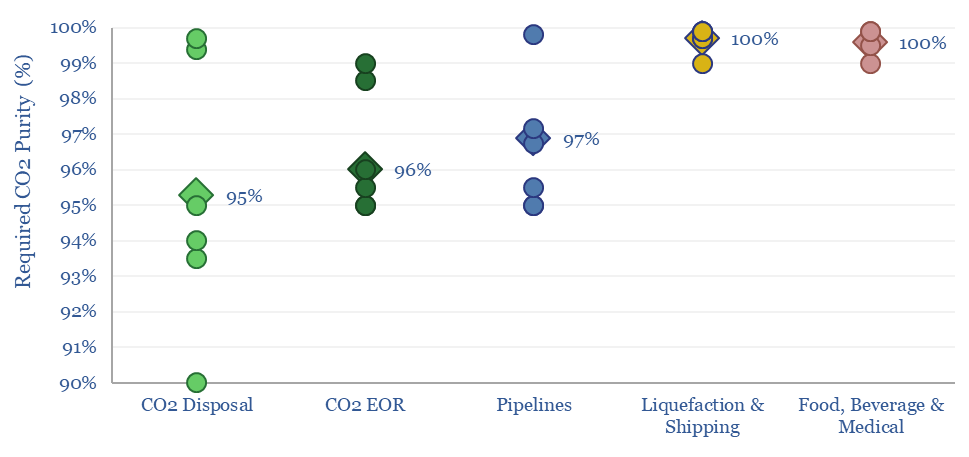
CCS: what CO2 purity for transport and disposal?

The minimum CO2 purity for CCS starts at 90%, while a typical CO2 disposal site requires 95%, CO2-EOR requires 96%, CO2 pipelines require 97% and CO2 liquefaction or shipping requires >99%. This data-file aggregates numbers from technical papers and seeks to explain CO2 purity for transport and disposal.
-
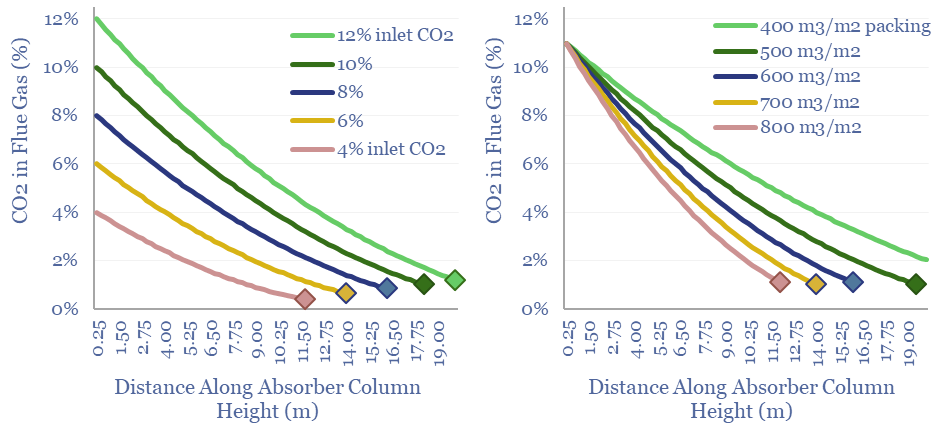
CCS absorbers: unit sizing and residence times?

Post-combustion CCS plants flow CO2 into an absorber unit, where it will react with a solvent, usually a cocktail of amines. This data-file quantifies operating parameters for CCS absorbers, such as their sizes, residency times, inlet temperatures, structural packings and the implications for retro-fitting CCS at pre-existing power plants.
-
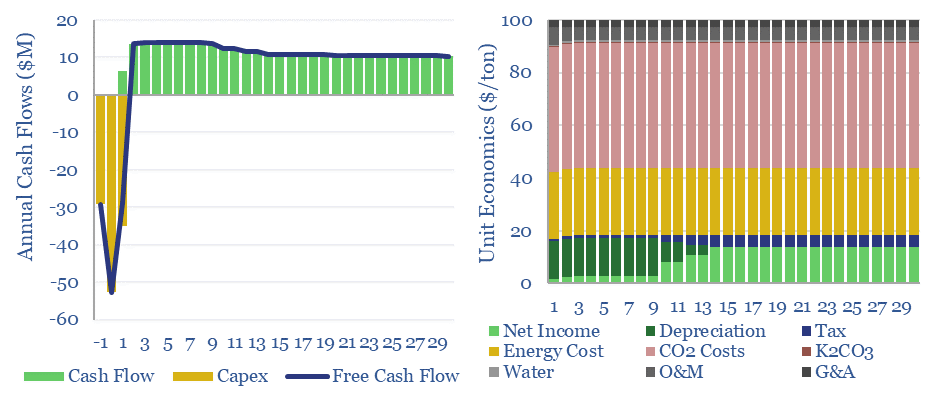
Hot potassium carbonate CCS: energy economics?

Hot potassium carbonate is a post-combustion CCS technology that bypasses the degradation issues of amines, and can help to decarbonize power, BECCS and cement plants. We think costs are around $100/ton and energy penalties are 30-50%. Potassium carbonate CCS can be stress-tested in this data-file, across 50 inputs.
-
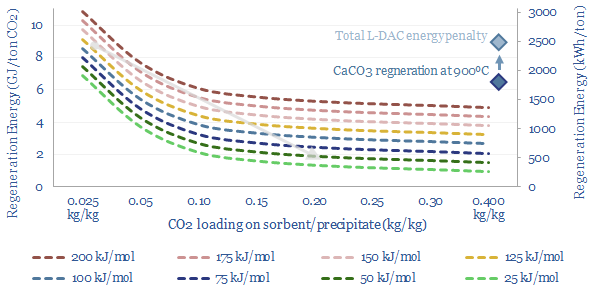
Origen Carbon: DAC breakthrough?
Origen Carbon Solutions is developing a novel DAC technology, producing CaO sorbent via the oxy-fuelled calcining of limestone with no net CO2 emissions. It is similar to the NET Power cycle, but adapted for a limestone kiln. The concept is very interesting. Our base case costs are $200-300/ton of CO2. This data-file contains our Origen…
-
DAC to the future?

A new wave of DAC companies has been emerging rapidly since 2019, targeting 50-90% lower costs and energy penalties than incumbent S-DAC and L-DAC, potentially reaching $100/ton and 500kWh/ton in the 2030s. Five opportunities excite us and warrant partial de-risking in this 19-page report. Could DAC even beat batteries and hydrogen in smoothing renewable-heavy grids?
Content by Category
- Batteries (89)
- Biofuels (44)
- Carbon Intensity (49)
- CCS (63)
- CO2 Removals (9)
- Coal (38)
- Company Diligence (95)
- Data Models (840)
- Decarbonization (160)
- Demand (110)
- Digital (60)
- Downstream (44)
- Economic Model (205)
- Energy Efficiency (75)
- Hydrogen (63)
- Industry Data (279)
- LNG (48)
- Materials (82)
- Metals (80)
- Midstream (43)
- Natural Gas (149)
- Nature (76)
- Nuclear (23)
- Oil (164)
- Patents (38)
- Plastics (44)
- Power Grids (130)
- Renewables (149)
- Screen (117)
- Semiconductors (32)
- Shale (51)
- Solar (68)
- Supply-Demand (45)
- Vehicles (90)
- Wind (44)
- Written Research (354)