US CO2 and Methane Intensity by Basin

US CO2 and Methane Intensity by Basin

The CO2 intensity of oil and gas production is tabulated for 500 distinct company positions across 12 distinct US onshore basins in this data-file. Using the data, we can break down the upstream CO2 intensity (in kg/boe), methane leakage rates (%) and flaring intensity (mcf/boe), by company, by basin and across the US Lower 48.


In this database, we have aggregated and cleaned up 1 GB of data, disclosed by the operators of 500 large upstream oil and gas acreage positions. The data are reported every year to the US EPA, and made publicly available via the EPA FLIGHT tool.

The database covers 85% of US onshore oil and gas from 2022, including 8.8Mbpd of oil, 100bcfd of gas, 25Mboed of total production, 462,000 producing wells, 800,000 pneumatic devices and 62,000 flares. All of this is disaggregated by acreage positions, by operator and by basin. It is a treasure trove for energy and ESG analysts.

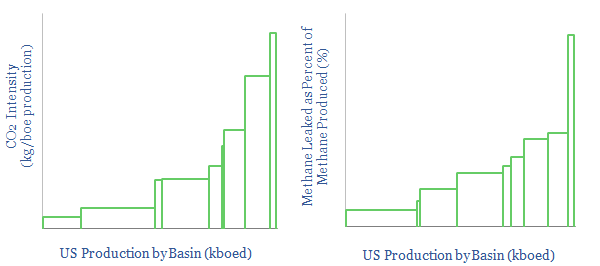
CO2 intensity. The mean average upstream oil and gas operation in 2022 emitted 10kg/boe of CO2e. Across the entire data-set, the lower quartile is below 3kg/boe. The upper quartile is above 12kg/boe. The upper decile is above 20kg/boe. And the upper percentile is above 70kg/boe. There is very heavy skew here (chart below).

CO2 intensity of US oil and gas production.

The main reasons are methane leaks and flaring. The mean average asset in our sample has a methane leakage rate of 0.16% in 2022 (down from 0.21% in 2021) and a flaring intensity of 0.024 mcf/boe (down from 0.028 mcf/boe in 2021). There is a growing controversy over methane slip in flaring, which also means these emissions may be higher than reported. Flaring intensity by basin is charted below.

Flaring intensity of US oil and gas production by basin. Bakken fields flare most, while Appalachian fields flare the least.

US CO2 intensity has been improving since 2018. CO2 intensity per basin has fallen by 21% over the past three years, while methane leakage rates have fallen by 22%. Activity has clearly stepped up to mitigate methane leaks.

CO2 intensity of US oil and gas production by basin. A comparison of 2021 and 2018.

Progress was made in 2022 in switching out bleeding pneumatic devices. Comparing 2022 vs 2021, our data-file contains 33,000 more wells (+8%), yet -3,100 fewer high-bleed pneumatic devices (-35%) and 14,000 fewer intermediate-bleed pneumatic devices (-3%). You can see who has most bleeding pneumatics still to replace in the data-file.

Most interesting is to rank the best companies in each basin, using the granular data, to identify leaders and laggards (chart below). A general observation is that larger, listed producers tend to have lower CO2 intensity, fewer methane leaks and lower flaring intensity than small private companies. Half-a-dozen large, listed companies stand out, with exceptionally low CO2 intensities. Please consult the data-file for cost curves (like the one below).

CO2 intensity of oil and gas production in the Bakken basin.

Methane leaks and flaring intensity can also be disaggregated by company within each basin. For example, the chart below shows some large Permian producers effectively reporting zero flaring, while others are flaring off over 0.1 mcf/bbl.

Flaring intensity of oil and gas production in the Permian basin.

All of the underlying data is also aggregated in a useful summary format, across the 500 different acreage positions reporting in to EPA FLIGHT, in case you want to compare different operators on a particularly granular basis.

US Refinery Database: CO2 intensity by facility?

US refinery database

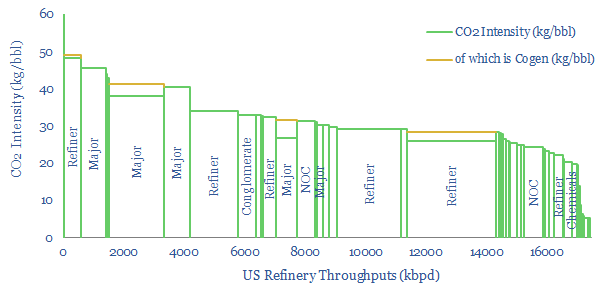
This US refinery database covers 125 US refining facilities, with an average capacity of 150kbpd, and an average CO2 intensity of 33 kg/bbl. Upper quartile performers emitted less than 20 kg/bbl, while lower quartile performers emitted over 40 kg/bbl. The goal of this refinery database is to disaggregate US refining CO2 intensity by company and by facility.


Every year, the c125 core refineries in the US, with c18Mbpd of throughput capacity report granular emissions data to the US EPA. The individual disclosures are something of a minefield, and annoyingly lagged. But this refinery database is our best attempt to tabulate them, clean the data and draw meaningful conclusions.

Some of the larger companies assessed in the data-file include Aramco, BP, Chevron, Citgo, Delek, ExxonMobil, Koch, HF Sinclair, Marathon, Phillips66, PBF, Shell and Valero.

The average US refinery emits 33kg of direct CO2 per barrel of throughputs, we estimate, with a 10x range running from sub-10 kg/bbl to around 100 kg/bbl (chart below).

US refinery database
125 US refineries ranked by CO2 intensity per barrel

Breakdown of direct US refinery emissions? The 33 kg/bbl average CO2 intensity of US refineries comprises 20 kg/bbl of stationary combustion, 8 kg/bbl of other refining processes, 3 kg/bbl of on-site hydrogen generation, 1 kg/bbl of cogeneration, 0.2 kg/bbl associated with methane leaks.

Some care is needed in interpreting the data. Refineries that are more complex, make cleaner fuels, make their own hydrogen (rather than buying merchant hydrogen) and also make petrochemicals are clearly going to have higher CO2 intensities than simple topping refineries. There is a 50% correlation between different refineries’ CO2 intensity (in kg/bbl) and their Nelson Complexity Index.

Correlation between the CO2 intensity of US refiners and their Nelson Complexity Index

Which refiners make their own hydrogen versus purchasing merchant hydrogen from industrial gas companies? This question matters, as hydrogen value chains come into focus. Those who control the Steam Methane Reformers may be readily able to capture CO2 in order to earn $85/ton cash incentives under the IRA’s reformed 45Q program, as discussed in our recent research note into SMRs vs ATRs. One SuperMajor and two pure play refiners stand out as major hydrogen producers, each generating 250-300kTpa of H2.

US refinery database
Which refiners make their own hydrogen versus purchasing merchant hydrogen

How has the CO2 intensity of US refineries changed over the past 3-years? The overall CO2 intensity is unchanged. However, some of the most improved refineries have lowered their CO2 intensities by 2-10 kg/bbl (chart below). Conversely, some Majors have seen their CO2 intensities rise by 2-7 kg/bbl.

US refinery database
Change-in-CO2-intensity-of-different-US-refiners-over-time

For further context and ideas, we have also published summaries of our key conclusions into downstream, vehicles and long-term oil demand. All of our hydrocarbon research is summarized here.

The full refinery database contains a granular breakdown, facility-by-facility, showing each refinery, its owner, its capacity, throughput, utilisation rate and CO2 emissions across six categories: combustion, refining, hydrogen, CoGen, methane emissions and NOx (chart below). The data-file was last updated in 2023 and covers the full US refinery landscape in 2018, 2019 and 2021, going facility by facility, and operator by operator.

Exploration capex: long-term spending from Oil Majors?

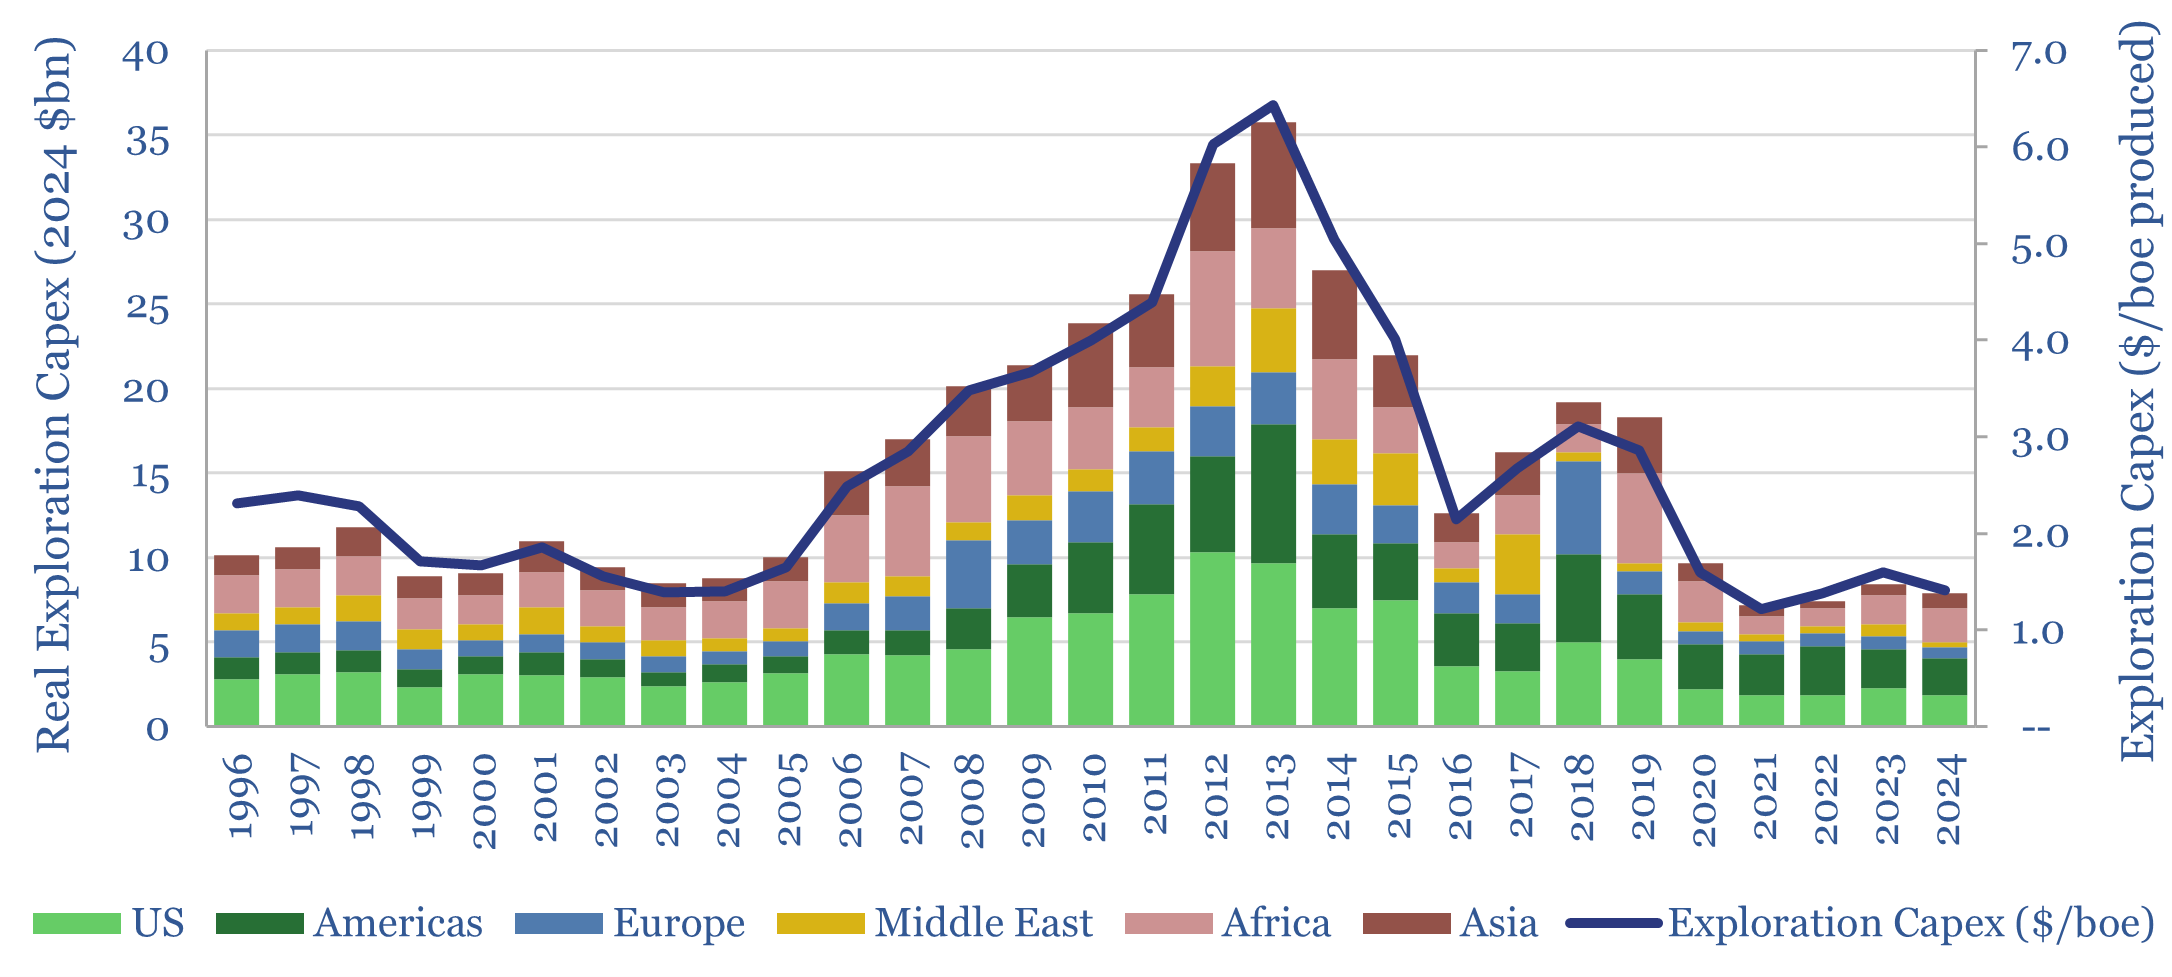
This data-file tabulates the Oil Majors’ exploration capex from the mid-1990s, in headline terms (in billions of dollars) and in per-barrel terms (in $/boe of production). Exploration spending quadrupled from $1/boe in 1995-2005 to $4/boe in 2005-19, and has since collapsed like a warm Easter Egg. One cannot help wondering about another cycle?


The peer group comprises ExxonMobil, Chevron, BP, Shell and TOTAL, which comprise c10% of the world’s oil production and 12% of the world’s gas production. As a good rule of thumb, this group can be thought of as c10% of global production.

This peer group quadrupled its exploration expenditures, from $5bn pa spent on exploration in 1995-2005 to an average of $20bn pa on exploration at the peak of the 30-year oil and gas cycle in 2010-2015. Exploration spend ramped from $1/boe to $4/boe over this timeframe. It has since fallen back to $1/boe, or around $1bn per company pa in 2022.

The US has always been the most favored destination, attracting c25% of all exploration investment, both offshore (e.g., Gulf of Mexico) and increasingly for short-cycle shale. During the last oil and gas cycle, the largest increases in exploration investment occurred in Africa, other Americas, Australasia; and to a lesser extent Europe and the Middle East.

One possible scenario for the future is that this peer group continues to limit its exploration expenditures to the bare minimum, below $1bn per company per year, or below $1/boe of production; under the watchwords of “capital discipline”, “value over volume” and “energy transition”.

However, it is somewhat terrifying to consider that the industry needed to spend an average of $2.5/boe on exploration from 2005-2019 in order to hold its organic production “flattish”.

Under-investment across the entire industry may foreshadow a sustained shortage of energy, especially if 50% lower-carbon gas is intended to replace coal as part of the energy transition, per our roadmap to net zero, or more pressingly as Europe faces sustained gas shortages. Hence one cannot help wondering if industry-wide exploration capex in the 2020s and 2030s is going to resemble the 2000s and 2010s?

This data-files aggregates the Oil Majors’ exploration capex, across ExxonMobil, Chevron, BP, Shell and TOTAL disclosures, apples-to-apples, back to 1995.

Gas-to-liquids: the economics?

the economics of gas-to-liquids

This data-file captures the economics of gas-to-liquids, including the formation of syngas in an auto-thermal reformer, then the subsequent upgrading into liquids via the Fischer-Tropsch reaction.

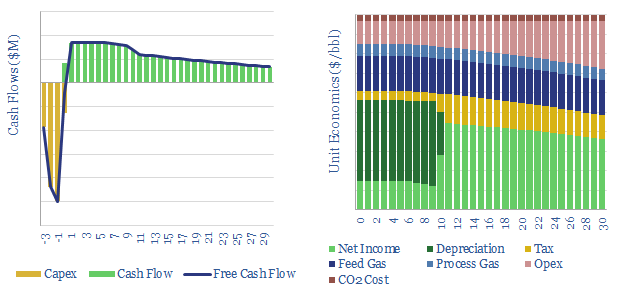
Our base case is that $100/bbl realizations are required for a 10% IRR. You can stress-test the economics as a function of gas prices, capex costs, thermal efficiencies, carbon intensity, CO2 prices and other operating costs.

Our inputs for each of the categories above are substantiated by collating data-points from past projects and technical papers. Finally, our notes and review of GTL patents are outlined in the final tabs.

Biomass accumulation: CO2 fixed by trees and energy crops?

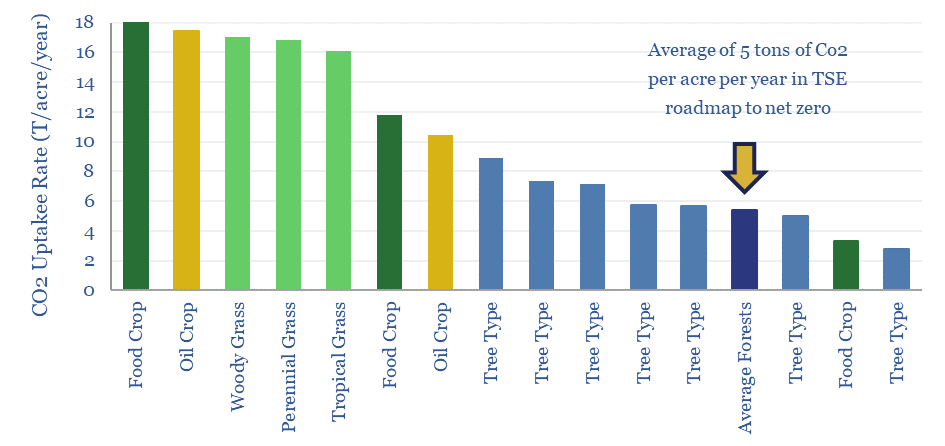
Different plant species fix 3-30 tons of CO2 per acre per year, as they accumulate biomass at 2-40 tons per hectare per year. The numbers matter for biofuels and for nature-based solutions. Hence this data-file compiles technical data into CO2 and biomass accumulation by plant species and by tree species, in different regions globally.


Biomass accumulation and CO2 fixation are quantified in this data-file, based on over 100 technical papers and other industry sources. Biomass accumulation is shown in dry tons per hectare per year. CO2 fixation is in tons per acre per year. Covered trees and crops include Bamboo, Corn, Elephant grass, Eucalyptus, Jatropha, Mangrove, Napier grass, Oak, Oil Palm, Pine, Poplar, Soybean, Spruce, Sugarcane and Teak.

Dry biomass yield for different trees, crops, and grasses.

The most likely Roadmap To Net Zero requires a 15-20GTpa CO2 sink using nature-based solutions, which in our base case, involves 3bn acres of reforestation, absorbing 5 tons of CO2 per acre per year. If we fail to hit this target, it is extremely unlikely we ever reach net zero.

5 tons of CO2 per acre per year is a conservative estimate for afforestation and reforestation initiatives, as CO2 uptake varies by species, by region and by year. Some tree species, especially in tropical climates, fix 7-12 tons of CO2 per acre per year, such as eucalyptus, teak, poplar and mangroves.

Biomass fixation can be 50%-5x higher, at 15-25 dry tons per hectare per year for some food crops and energy crops, fixing 10-20 tons per acre per year of CO2.

But only a portion of that dry biomass is directly usable, for example as corn (45% of the dry corn plant), soybeans (40%), sugar (35%), palm oil (20%), jatropha oil (10%).

When used as food, no net CO2 is sequestered, of course, as the sugars, starches and proteins get metabolized then respired (yielding CO2), or egested and then decomposed (yielding biogas and/or CO2).

When used for energy, usable biomass can be upgraded into biofuels, which then substitute for hydrocarbons. However, fermentation, biodiesel production or upgrading to jet can directly release CO2, or otherwise be so energy intensive, that it would have been more climate-positive simply to reforest the land that was used to grow the energy crops. The answer varies case by case.

The real opportunity in biofuels therefore is to also harness 50-90% of the lignocellulosic energy that is contained in fast-growing grasses and crops, but which is not currently useful, and thus ends up decomposing. This could involve digestion into biogas, combusting sugar ethanol bagasse for power, second generation ethanol, bright green hydrogen, or fascinating options such as biochar.

The data-file tabulates hundreds of data-points from technical papers and industry reports on different tree and grass types. It also covers their growing conditions, survival rates, lifespans, rates of CO2 absorption (per tree and per acre) and their water requirements (examples below).

CO2 uptake rates in forests by tree type

LNG plant footprints: compaction costs?

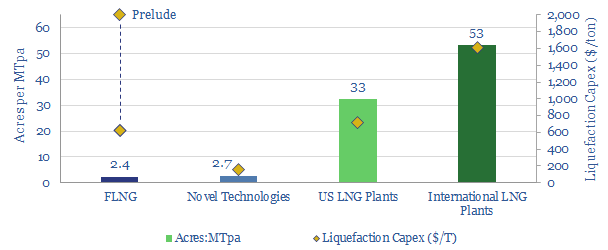
This data file tabulates the acreage footprints and peak worker counts at c20 recent LNG projects. It is interesting how these variables are likely to change over time, to lower costs and due to COVID.


International LNG occupies c50-acres per MTpa and 1,000 peak workers per MTpa of capacity. This means that largest facilities can have over 20,000 workers on site at any one time, which will be challenging amidst COVID.

US LNG projects have been smaller, at c30-acres per MTpa, as high-quality input gas requires less pre-processing; and worker counts are as much as 4x lower, due to phased, modular construction designs (see below).

FLNG is c20x more compact than typical international projects but and has the highest density of workers. Modules which typically have large exclusion zones are congested. This will require extremely cautious operation. It could impact economics, through higher costs and lower up-times.

In principle, smaller plants should achieve cost advantages over larger plants. To reap these benefits, we are excited by novel “liquefaction” technologies, which are also tabulated in the file.

Ventures for an Energy Transition?

Oil Major Venture Investments

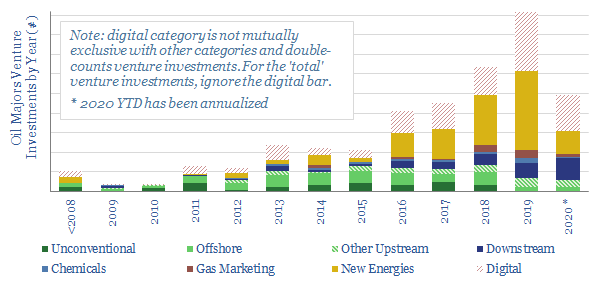
This database tabulates almost 300 venture investments made by 9 of the leading Oil Majors, as the energy industry advances and transitions.


The largest portion of activity is now aimed at incubating New Energy technologies (c50% of the investments), as might be expected. Conversely, when we first created the data-file, in early-2019, the lion’s share of historical investments were in upstream technologies (c40% of the total). The investments are also highly digital (c40% of the total).

Four Oil Majors are incubating capabilities in new energies, as the energy system evolves. We are impressed by the opportunities they have accessed. Venturing is likely the right model to create most value in this fast-evolving space.

The full database shows which topic areas are most actively targeted by the Majors’ venturing, broken down across 25 sub-categories, including by company. We also chart which companies have gained stakes in the most interesting start-ups.

Shell: the future of LNG plants?

Shell LNG Pipeline

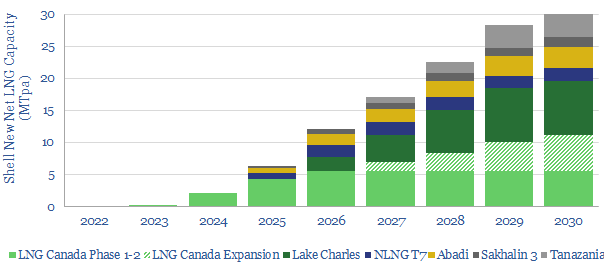
Shell is revolutionizing LNG project design, based on reviewing 40 of the companyโ€™s gas-focused patents from 2019. The innovations can lower LNG facilitiesโ€™ capex by 70% and opex by 50%; conferring a $4bn NPV and 4% IRR advantage over industry standard greenfields. Smaller-scale LNG, modular LNG and highly digitized facilities are particularly abetted. This note reviews Shellโ€™s operational improvements, revolutionary greenfield concepts, and their economic consequences.

Carbon Capture Costs at Refineries?

Carbon Capture Costs at Refineries

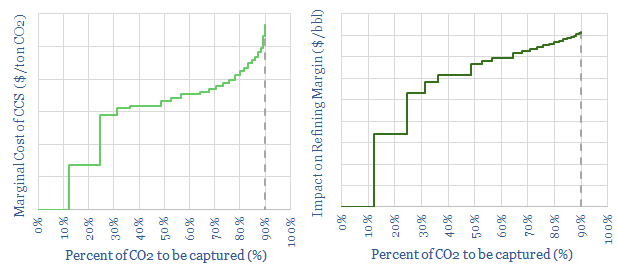
This model calculates the costs of post-combustion carbon capture at a world-scale refinery, using today’s commercially available CCS technologies. The aim is to see whether the process could be economically competitive, as oil refineries emit c1bn tons of CO2 per annum.

Carbon capture costs vary unit-by-unit, as a function of the unit’s size and the CO2-concentration in its flue gas. Hence we estimate that c10-20% of refinery emissions can be eliminated for $XX/ton, the “middle 50%” will cost c$XX-XX/ton, while the final 20% will cost $XX-XX/ton. Calculations can be flexed in the model, using alternative input assumptions.

Our estimates are informed by an excellent technical paper from Shell, which is also summarised.

Overview of Downstream Catalyst Companies

Companies in Refining Catalysts

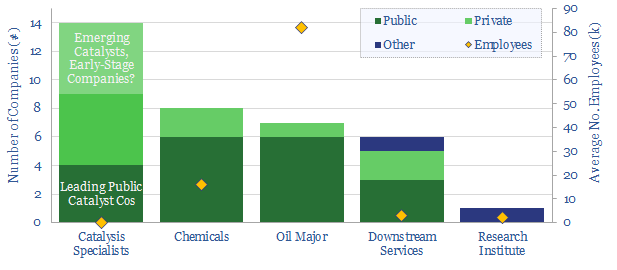
This data-file tabulates details of the c35 companies commercialising catalysts for the refining industry.  Improved catalysts are aimed at better yields, efficiencies and energy intensities. This is the leading route we can find to lower refining sector CO2 emissions.

In particular, we find five early-stage companies are aiming to commercialise next-generation refining catalysts.

We also quantify which Majors have recently filed the most patents to improve downstream catalysts.

If you would like us to expand the data-file, or provide further details on any specific companies, then please let us knowโ€ฆ

Copyright: Thunder Said Energy, 2019-2024.