-
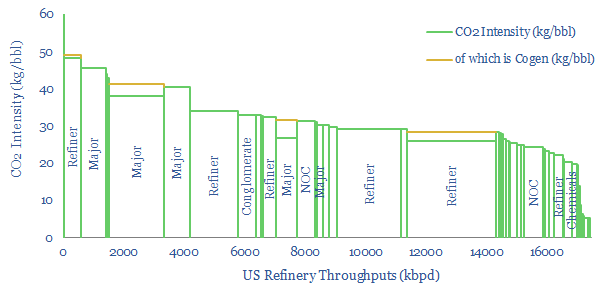
US Refinery Database: CO2 intensity by facility?

This US refinery database covers 125 US refining facilities, with an average capacity of 150kbpd, and an average CO2 intensity of 33 kg/bbl. Upper quartile performers emitted less than 20 kg/bbl, while lower quartile performers emitted over 40 kg/bbl. The goal of this refinery database is to disaggregate US refining CO2 intensity by company and…
-
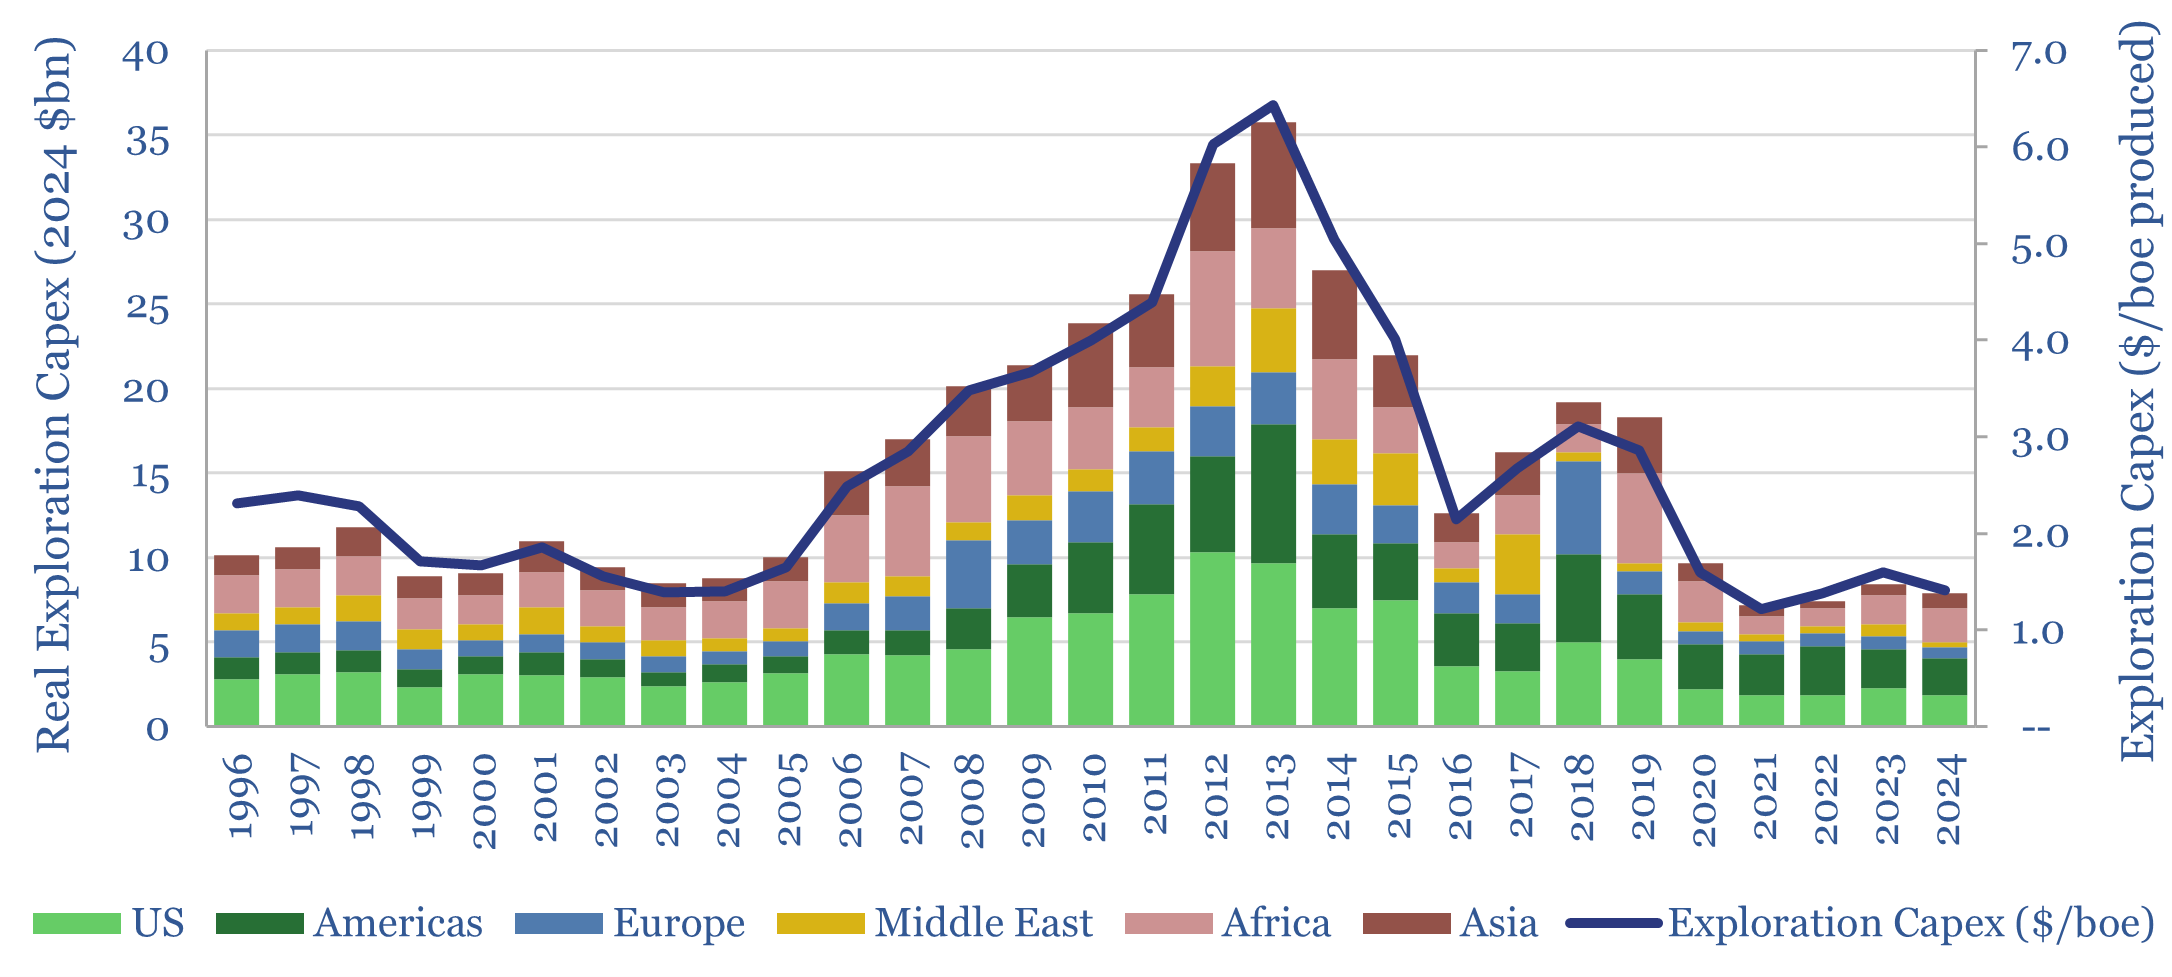
Exploration capex: long-term spending from Oil Majors?

This data-file tabulates the Oil Majors’ exploration capex from the mid-1990s, in headline terms (in billions of dollars) and in per-barrel terms (in $/boe of production). Exploration spending quadrupled from $1/boe in 1995-2005 to $4/boe in 2005-19, and has since collapsed like a warm Easter Egg. Exploration has been de-prioritized. Perhaps wrongly?
-
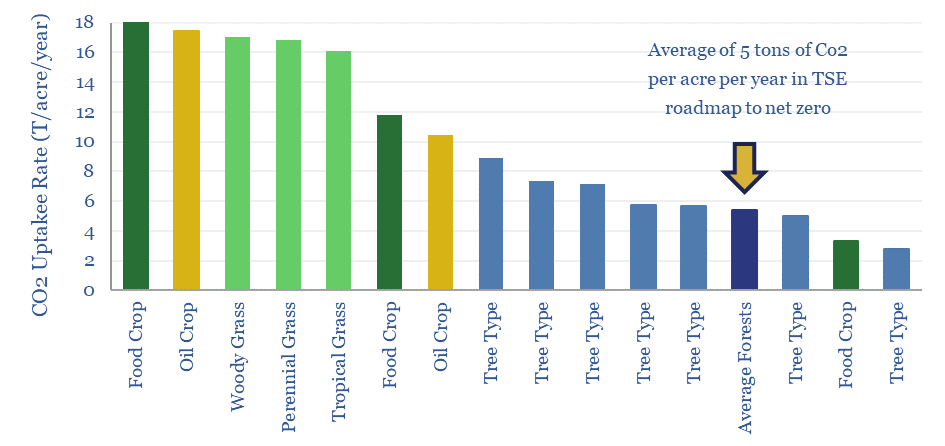
Biomass accumulation: CO2 fixed by trees and energy crops?

Different plant species fix 3-30 tons of CO2 per acre per year, as they accumulate biomass at 2-40 tons per hectare per year. The numbers matter for biofuels and for nature-based solutions. Hence this data-file compiles technical data into CO2 and biomass accumulation by plant species and by tree species, in different regions globally.
-
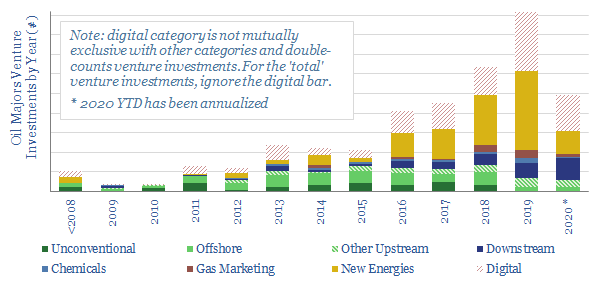
Ventures for an Energy Transition?

This database tabulates c300 venture investments, made by 9 of the leading Oil Majors. Their strategy is increasingly geared to advancing new energies, digital technologies and improving mobility. Different companies are compared and contrasted, including the full list of venture investments over time.
-
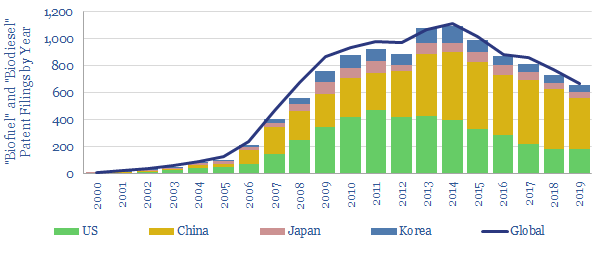
Biofuel, green diesel, renewable diesel: where’s the IP?

This data-file tracks 5,000 patents filed into biofuels: by geography, by company and particularly in 2017-20. The pace of research activity has been waning since 2014. Sinopec screens as the technology leader. The data-file also identifies the ‘Top Ten’ Western companies, ranked by recent patent filings.
-
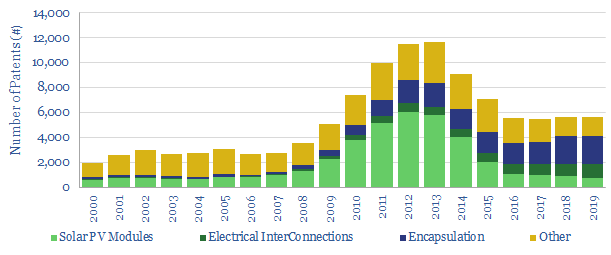
Solar Energy: Where’s the IP?

We have tabulated 110,000 solar patents. Research peaked in 2012-13, at 11,500 patents/year. It since slowed to c6,000/year. Yet Chinese companies have ramped up to 50% of all the filings, and now comprise 14 out of 2019’s top 25 solar patent filers. Majors’ patents comprise c0.5% of the total, with one SuperMajor clearly leading.
-
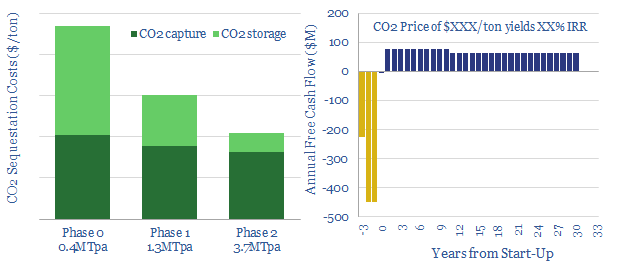
Northern Lights CCS: the economics?

We have modeled out simple economics for Northern Lights, the most elaborate CCS scheme proposed by the energy industry (Equinor, Shell, TOTAL). The project involves capturing 1.3-1.5MTpa of industrial CO2, shipping it, piping it 110km offshore, then injecting it 3,000m below Norway’s seabed. Costs are expensive. But phase 2 could benefit from scale, offering “CO2…
-
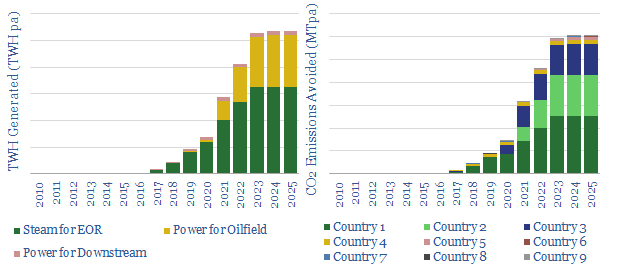
Solar Use within the Oil Industry?
20 solar projects are being undertaken across the oil industry, to reduce CO2 emissions. But today’s project pipeline will obviate less than 1% of oil industry CO2 by 2025. So momentum must build behind these leading examples, which are: steam-EOR in Oman and California, Solar PV in the Permian, and specific companies such as Occidental,…
-
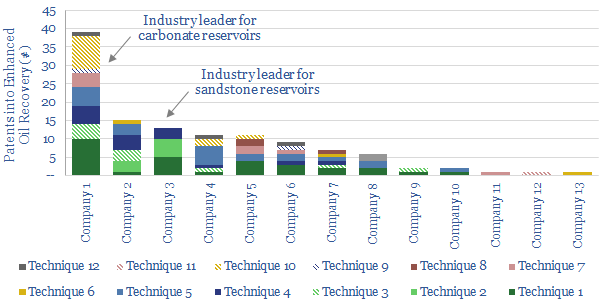
At the cutting edge of EOR?

This data-file summarises 120 patents into Enhanced Oil Recovery, filed by the leading Oil Majors in 2018. Hence, we can identify clear leaders in EOR technology, and what they are doing at the cutting edge, to improve recovery and lower decline rates. As the world’s oilfields age, leading EOR technology will help avoid the higher…
-
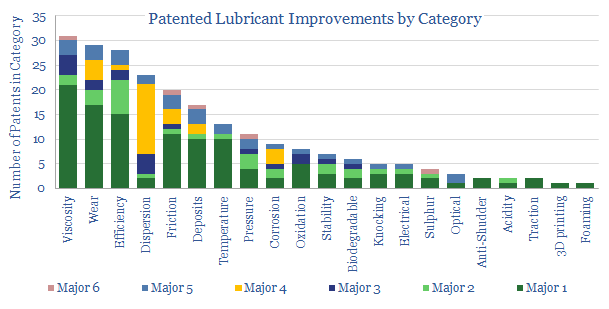
Lubricant Leaders: our top five conclusions

We present our “top five” conclusions on the lubricants industry, after reviewing 240 patents, filed by Oil Majors in 2018. We are most impressed by the intense pace of activity to improve engine efficiencies. Technology will drive margins and market shares, hence three clear market leaders are identified. The relative number of patents into Electric…
Content by Category
- Batteries (87)
- Biofuels (42)
- Carbon Intensity (49)
- CCS (63)
- CO2 Removals (9)
- Coal (38)
- Company Diligence (92)
- Data Models (822)
- Decarbonization (159)
- Demand (110)
- Digital (58)
- Downstream (44)
- Economic Model (200)
- Energy Efficiency (75)
- Hydrogen (63)
- Industry Data (275)
- LNG (48)
- Materials (81)
- Metals (74)
- Midstream (43)
- Natural Gas (146)
- Nature (76)
- Nuclear (23)
- Oil (162)
- Patents (38)
- Plastics (44)
- Power Grids (124)
- Renewables (149)
- Screen (112)
- Semiconductors (30)
- Shale (51)
- Solar (67)
- Supply-Demand (45)
- Vehicles (90)
- Wind (43)
- Written Research (347)