
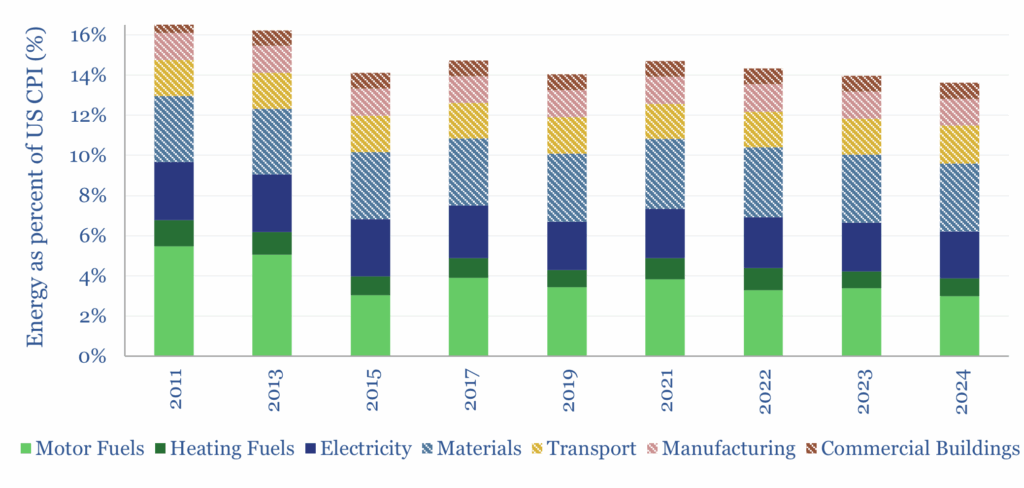
Energy is c15% of the US CPI basket, on average, from 2011-24. In other words, if energy prices suddenly doubled, this would ultimately create c15% inflation. c7% of the total is direct energy use and another 8% is energy embedded in other goods and services, as quantified in this look-through analysis.
Granular data are available from the US Bureau of Labor Statistics into the composition of the US CPI basket. From 2011-24, 7% of the CPI basket comprises direct energy purchases from consumers, of which 3.8% is motor fuels, 2.6% is electricity and 1% is heating fuels.
However, the remaining 93% of the CPI basket also embeds the cost of energy. If we take airfare, as an example, which is 0.7% of the CPI basket, we calculate that 18% of commercial aviation costs are themselves composed of fuel costs.
As another example, sugar is 0.04% of the US CPI basket, and when we model the costs of sugar production, energy comprises 7% of the total production cost, then another 4% of the retail price is composed of the energy embedded in shipping.
And then moreover, if we take all of the data into food retail outlets in the United States, the energy costs of running those supermarkets and stores (mainly electricity) runs to 1.7% of their economic output, based on data from the US CBECS.
Hence our goal in this data-file is a look-through of the entire US CPI basket, drawing on all of our economic models, to estimate the share of the US CPI basket that is energy, on both a direct and indirect (embedded) basis.
Energy has fallen from 17% of the CPI basket in 2011 to 14% in 2024, slowing inflation by around 0.3% per year, while the CPI nevertheless rose at 2.6% per year. This has mostly been driven by lower oil prices.
CPI categories that have deflated most are technology (e.g. computers, 0.3% of the basket, falling -5% per year) and communications (e.g., cell service, 1.6%, falling at -1.4% pa).
CPI categories that have inflated most are housing (33% of the basket, +3.7% pa) and services (e.g., restaurants at 5.6% and +3.7% pa), which perhaps explains cost-of-living concerns.
One interpretation of the data above is that US monetary policy since 2008-09 has really been driving inflation at 3-4% per year, which has been softened by advances in energy and tech. Persistently high inflation benefits commodities and real assets?