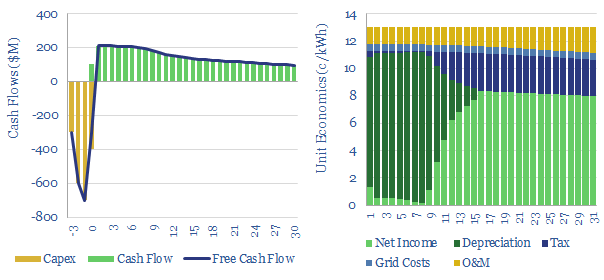
This model estimates the levelized cost of offshore wind at 13c/kWh, to generate a 7% IRR off of capex costs of $4,000/kW and a utilization factor of 40-45%. Each $400/kW on capex adds 1c/kWh and each 1% on WACC adds 1.3 c/kWh to offshore wind levelized costs.
The levelized costs of offshore wind are built up in this economic model, and a flat price of 13c/kWh is needed, over a 25-30 year project life, in order to generate a 7% IRR.
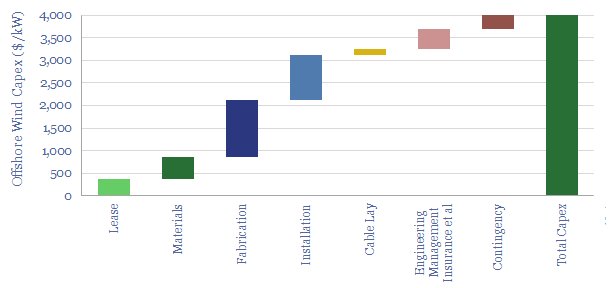
Capex costs of offshore wind are estimated at $4,000/kW in our base case (chart below), and these numbers are drawn in turn from our wind materials balance, material commodity price database, offshore vessel database, wind turbine manufacturing data-file and HVDC cable database. This also tallies with recent offshore wind projects that we have tracked. If anything, actual costs come in higher, due to unforeseen delays and overruns inherent in large-scale construction. The capex numbers can all be flexed in the data-file.
Operating costs of wind turbines are aggregated in our data-file here. Decline curves of wind turbines are aggregated in our data-file here. Our estimate of grid connection charges is based on tracking past projects and the need for synthetic inertia and reactive power compensation. Decision-makers are welcome to reflect or ignore these costs, but we recommend understanding them and reflecting them.
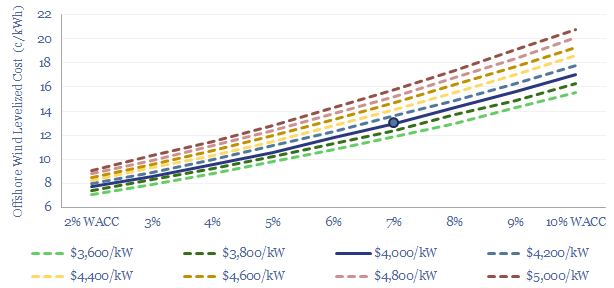
Levelized costs of offshore wind are most dependent upon WACCs, as effectively all of the costs are capex costs, incurred up front, unlike other power generation sources. A rule of thumb is that each 1% variation in WACC impacts levelized cost by 1.3 c/kWh and each $400/kW on the capex impacts levelized cost by 1c/kWh. Although for more detailed numbers, these two variables are interdependent (sensitivity chart below).
What is the levelized cost of offshore wind? Our 13c/kWh estimate is a flat estimate over 25-30 years. I.e., it means that the weighted average sales price of electricity must run at 13c/kWh in order to generate a 7% IRR. We would note that some other commentators have published levelized costs using quite different financial assumptions…
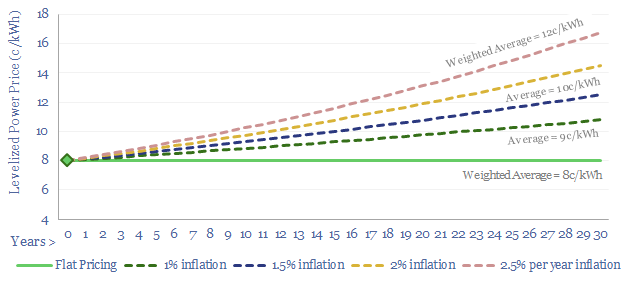
Some other commentators have WACCs in the range of 3-5% (the Fed Funds Rate is above 5% in 2023). Others publish numbers on a ‘real’ basis, which means that the price in Year 1 escalates over time, e.g., with inflation. So for example, what is quoted as an 8c/kWh ‘real levelized cost’ really means 10c/kWh over the life of the project and 14c/kWh by the end of the project (chart below). To be clear, our numbers are nominal numbers, and do not juice the IRR by assuming an annual price escalation.
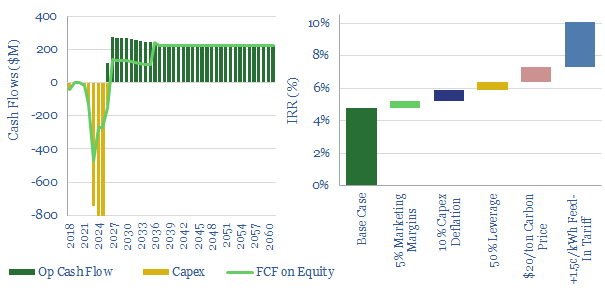
A detailed case study is also presented in the data-file, covering the 816MW Empire Wind project, off New York, constructing c80 x c10 MW wind turbines, each as tall as the Chrysler building. Base case IRRs would be in single digits. The model explores how hypothetical initiatives might uplift the returns, including power marketing, continued cost-deflation, leverage, carbon prices and feed-in tariffs (chart below).
Please download the data-file to stress test the economics of offshore wind projects, and see how levelized costs vary with capex, opex, utilization rates, taxes and other costs. For comparison, our economic model for onshore wind projects is linked here.
