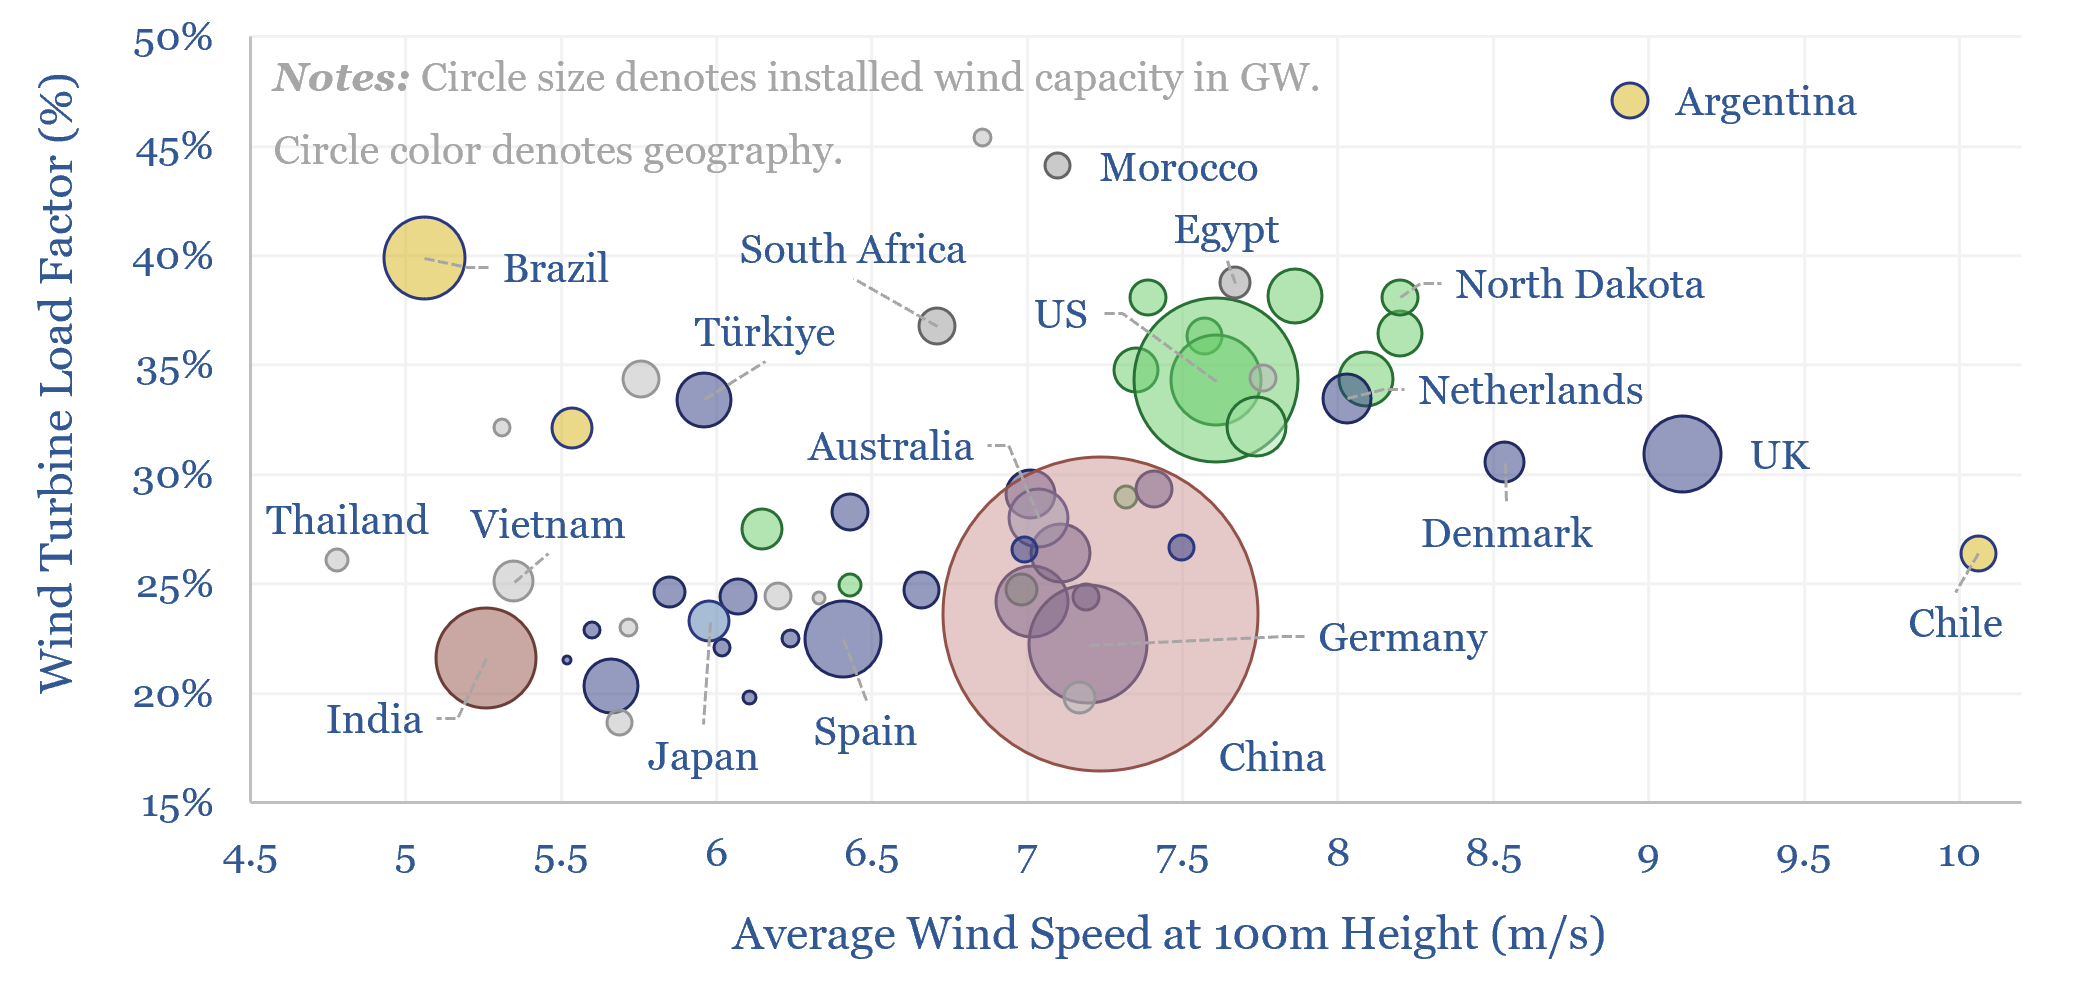
To what extent are wind turbine load factors determind by wind speeds? We found a 45% correlation between utilization factors of wind turbines and average wind speeds across different countries. Median global wind speed at 100m height is 7m/s (ranging from 2 to 20m/s) while the median wind turbine load factor is 27% (mostly ranging from 15% to 45%).
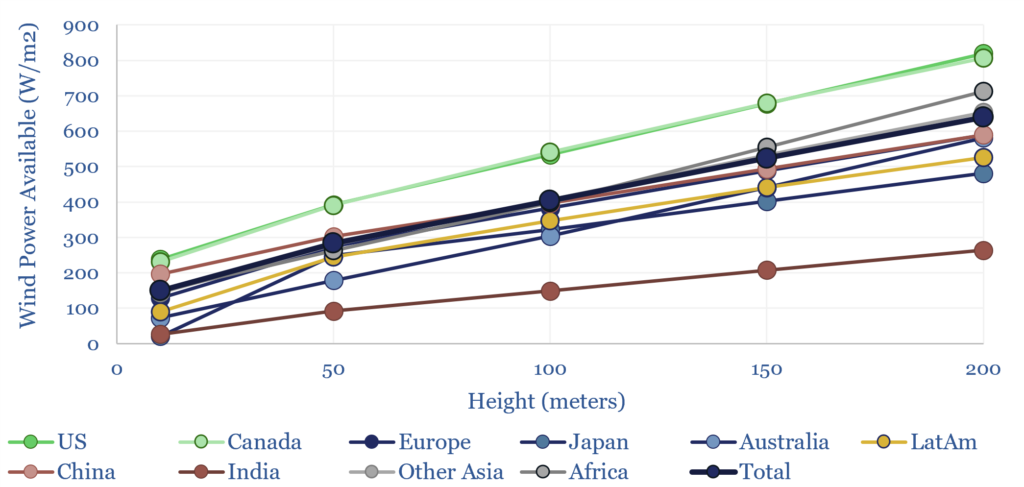
Median wind speeds globally are 4m/s at 10m altitude, rising to 6m/s at 50m, 7m/s at 100m and 8m/s at 150-200m. Available wind power is a cube-function of wind speed, which means 280 W/m2 is available on average at 50m, doublging to 520 W/m2 at 150m, which would be the primary argument for re-powering old wind turbines. But let us look 100m above the surface in our numbers below…
The “windiest place on Earth” is said to be Commonwealth Bay, off Antarctica, at -67 degrees latitude, exacerbated by a concentrated flow of cold air flowing off a nearby ice sheet. Average wind speeds are 80-100kmph, or 25-30m/s. The Southern tip of Patagonia can reach 24m/s. The Faroe Islands reach 17m/s. The Tibetan plateau reaches 13m/s. The Scottish highlands can reach 12 m/s. Saudi Arabia’s deserts or the US’s Great Plains can reach 10m/s.
The least windy places on Earth tend to lie in the wind shadows behind mountain ranges, around the equator, or on rough terrain. This includes the heart of the Amazon rainforest (2m/s), the Borneo rainforest (1.5m/s), just East of the Alps at say, Piemonte (2m/s), or just South of the Himalayas (2m/s).
Another general rule is that wind speeds are highest at mid-latitudes, from 30-60 degrees, as this is where the temperature contrast is sharpest between hot air at the equator and cold air at the poles, causing large air masses to flow and swirl around. So how does this all correlate with actual wind turbine load factors?
The average wind turbine installed globally has run with a utilization rate of 27%, ranging from 13% in Slovakia to 47% in Argentina. We found a 45% correlation between utilization factors or wind turbines and average wind speeds across different countries.
This correlation is lower than we expected, due to statistical reasons. For example, Switzerland is an outlier in our correlation, with an average wind speed of 6 m/s (in line with the global median) yet only a 20% utilization rate on its wind turbines (bottom decile). Wind speeds reach 10m/s at the 4,478m summit of the Matterhorn. But flatter sites the can easily host wind turbines only see 2-4m/s wind speeds.
Brazil is another outlier, with 2m/s wind speeds in its NW Rainforests, which cover half of the country, while wind speeds reach 7-12m/s in the Eastern/Atlantic state of Bahia and Rio Grande do Norte, which leads the nation in wind development.
Load factors are important for wind turbine economics. Halving the load factor, all else equal, doubles the levelized cost of onshore wind or the levelized cost of offshore wind.
Hence overall our analysis does suggest that some major energy-consuming regions may have less wind resources available: India, South-East Asia, Japan, Spain and Central Europe. This matters for our forecasts of global wind additions and for global electricity supply by region. Global solar resources are 20-100x larger than global wind resources.
The Global Wind Atlas is the underlying source for this analysis: a fantastic open-source tool, from the World Bank and the Technical University of Denmark (DTU Wind), estimating mean wind speeds, every 250m, across all the world’s land area, and up to 200-miles offshore. Generally, available wind power is proportional to air density x wind speed ^ 3, as integrated across the statistical distribution of wind speeds.
Data in Global Wind Atlas are based on the ERA5 dataset from the European Centre for Medium-Range Weather Forecasts (ECMWF), which cover all of 2008-17, with 30km resolution. Data are then adjusted in a Python-based API, to reflect local terrain and surface features, including those captured by the European Space Agency’s WorldCover dataset. Model outputs have been validated by measurements in 52 sites in 7 individual countries ranging from Bangladesh to Zambia, with an average absolute bias of c10%. Global Wind Atlas asks to be cited as follows:
Data obtained from the Global Wind Atlas version 4.0, a free, web-based application developed, owned and operated by the Technical University of Denmark (DTU). The Global Wind Atlas version 4.0 is released in partnership with the World Bank Group, utilizing data provided by Vortex, using funding provided by the Energy Sector Management Assistance Program (ESMAP). For additional information: https://globalwindatlas.info
Our own data-file tabulates wind turbine load factors, across 60 major wind-producing countries and wind-producing US States. Then we have also tabulated data from the Global Wind Turbine Atlas, for each region, reflecting wind speed and wind power; at 10m, 50m, 100m, 150m and 200m; in the median location and in the 10% windiest locations.