Search results for: “LFP batteries”
-
Graphite: upgrade to premium?
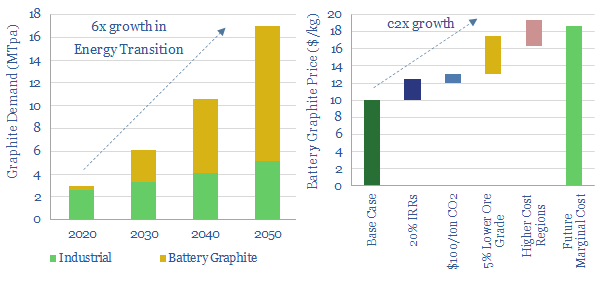
Global graphite volumes grow 6x in the energy transition, mostly driven by electric vehicles. We see the industry moving away from China’s near-exclusive control. The future favors a handful of Western producers, integrated from mine to anode, with CO2 intensity below 10kg/kg. This 10-page note outlines the opportunity.
-
Lithium from brines: the economics?
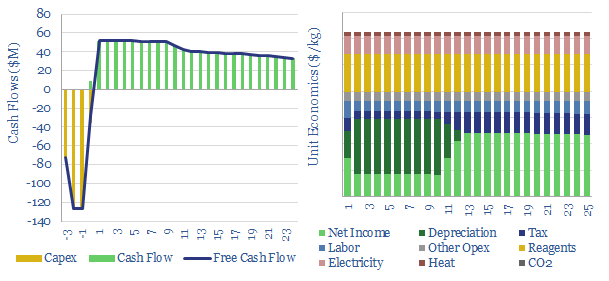
This data-file approximates the costs of battery-grade lithium from brines, via traditional salars the emerging technology of direct lithium extraction. Costs are c40-60% lower than mined lithium in ($/ton of lithium carbonate equivalent). CO2 intensity is 50-80% lower (in kg/kg).
-
Direct lithium extraction: ten grains of salt?
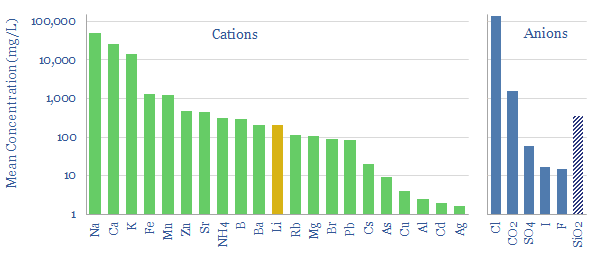
Direct Lithium Extraction from brines could help lithium scale 30x in the Energy Transition; with costs and CO2 intensities 30-70% below mined lithium; while avoiding the 1-2 year time-lags of evaporative salars. This 15-page note reviews the top ten challenges that decision-makers need to de-risk.
-
Wind and solar: cost of grid interconnection?
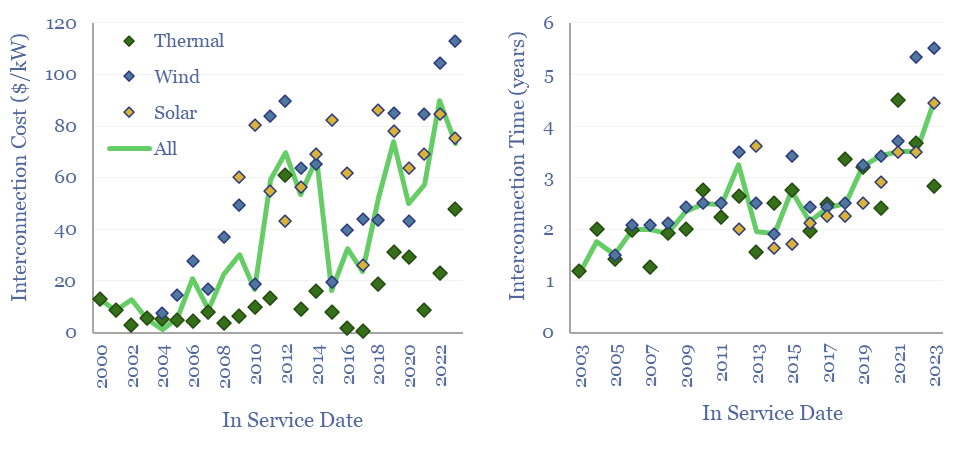
Cost of grid connection is shaping up to be a major bottleneck for the continued acceleration of new energies. A good baseline is to expect $100-300/kW of grid inter-connection costs, or $3-10/kW-km, over a typical distance of 10-70 km. But the requirement to fund network upgrade costs can push grid connections to cost more than…
-
East to West: re-shoring the energy transition?
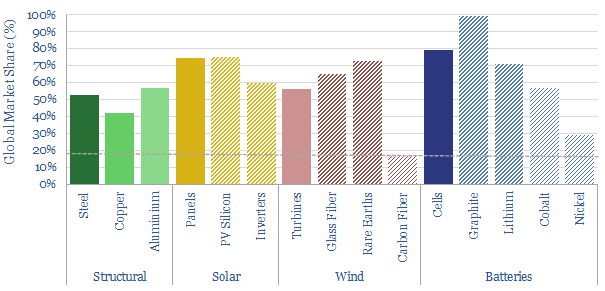
China is 18% of the world’s people and GDP. But it makes c50% of the world’s metals, 60% of its wind turbines, 70% of its solar panels and 80% of its lithium ion batteries. Re-shoring is likely to be a growing motivation after events of 2022. This 14-page note explores resultant opportunities.
-
HVDC transmission: leading companies?
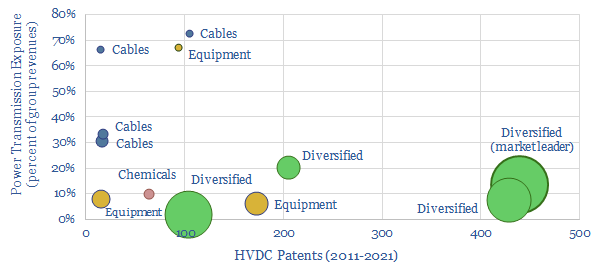
The global HVDC market is $10bn pa, and it might typically cost c€100-600 M to connect a large and remote renewables project to the grid or run a small HVDC inter-connector. This data-file reviews the market leaders in HVDC, based on 5,500 patents. A dozen companies stand out, with c$40bn of combined revenues from power…
-
Power transmission: inter-connectors smooth solar volatility?
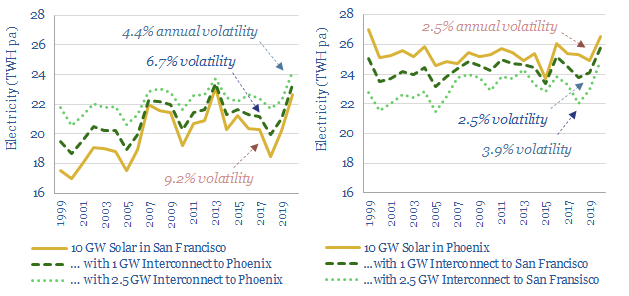
Can large-scale power transmission smooth renewables’ volatility? To answer this question, this horrible 18MB data-file aggregates 20-years of hour-by-hour solar insolation arriving at four cities in the US. The volatility in year-by-year can be halved by a single inter-connector.
-
Energy efficiency: an overview?
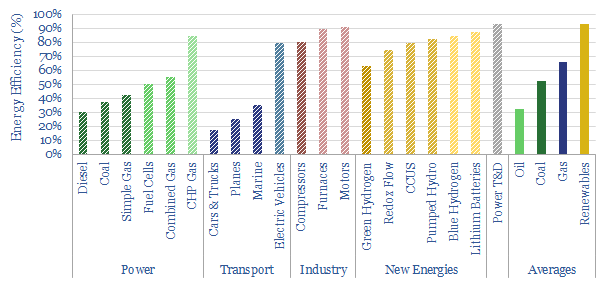
This data-file is an overview of energy efficiency. The average power generation facility is c40% efficient. The average ICE is 20%. The average EV is 80%. The average industrial process is 85%. Some new energies have efficiency losses.
-
Solar volatility: second by second output data?
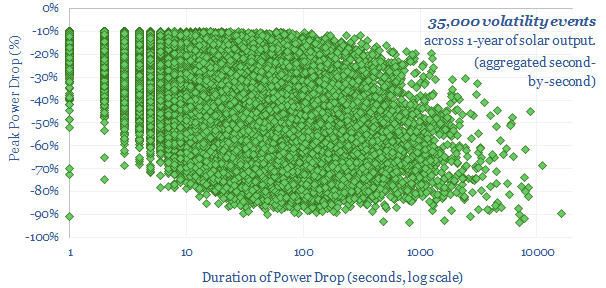
We have aggregated the volatility and power drops across an entire year of second-by-second solar data. Each day typically sees 100 volatility events where output drops by over 10%, and 10 events where output drops by over 70 events. Volatility also varies day by day.
-
Green hydrogen: can electrolysers run off renewables?
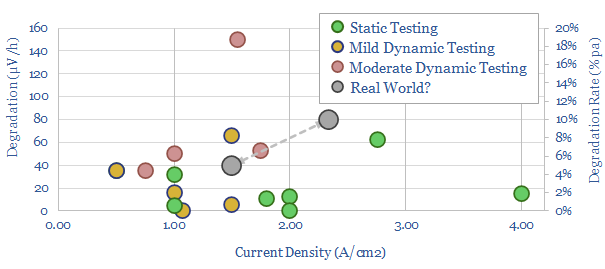
What degradation rate is expected for a green hydrogen electrolyser, if it is powered by volatile wind and solar inputs? This 15-page note reviews past projects and technical papers. 5-10% pa degradation rates would raise green hydrogen costs by $1/kg. Avoiding degradation justifies higher capex, especially on power-electronics and even batteries?
Content by Category
- Batteries (89)
- Biofuels (44)
- Carbon Intensity (49)
- CCS (63)
- CO2 Removals (9)
- Coal (38)
- Company Diligence (94)
- Data Models (838)
- Decarbonization (160)
- Demand (110)
- Digital (59)
- Downstream (44)
- Economic Model (204)
- Energy Efficiency (75)
- Hydrogen (63)
- Industry Data (279)
- LNG (48)
- Materials (82)
- Metals (80)
- Midstream (43)
- Natural Gas (148)
- Nature (76)
- Nuclear (23)
- Oil (164)
- Patents (38)
- Plastics (44)
- Power Grids (130)
- Renewables (149)
- Screen (117)
- Semiconductors (32)
- Shale (51)
- Solar (68)
- Supply-Demand (45)
- Vehicles (90)
- Wind (44)
- Written Research (354)