Search results for: “solar volatility”
-
Wind power: energy costs, energy payback and EROEI?
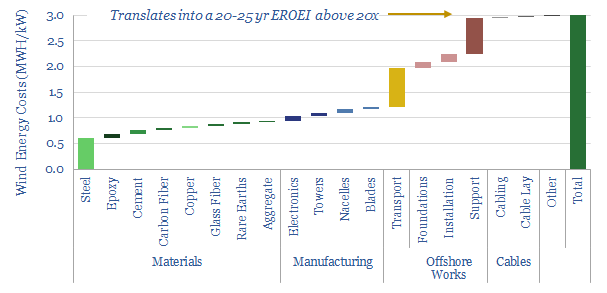
This data-file estimates 3MWH of energy is consumed in manufacturing and installing 1kW of offshore wind turbines, the energy payback time is usually around 1-year, and total energy return on energy invested (EROEI) will be above 20x. These estimates are based on bottom-up modelling and top-down technical papers.
-
Energy return on energy invested?
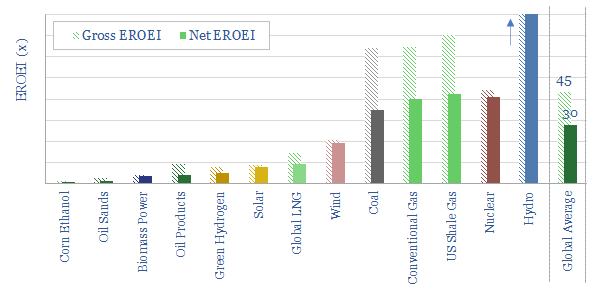
Global average EROEI is around 30x. Sources with EROEI above average are hydro, nuclear, natural gas and coal. Sources with middling EROEIs of 10-20x are solar, wind and LNG. Sources with weaker EROEIs are oil products, green hydrogen and some biofuels.
-
Japan: nuclear restart tracker?
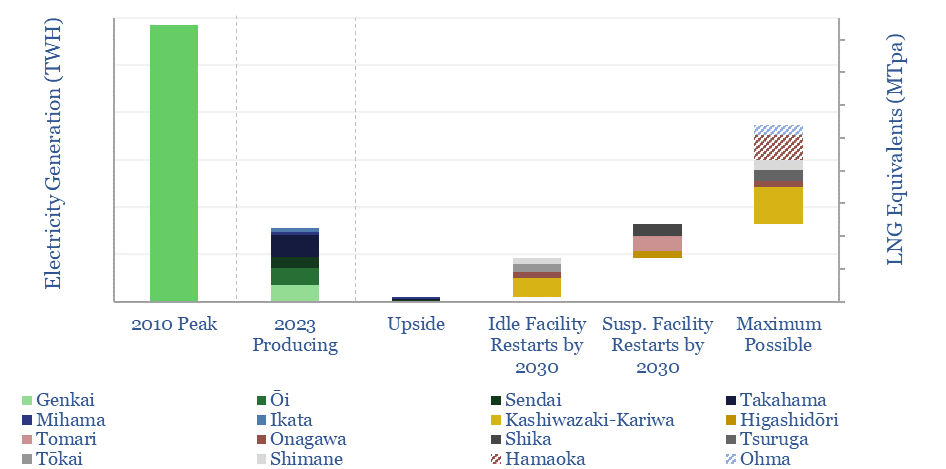
This data-file on looks through 17 major nuclear plants in Japan with 45GW of operable capacity, covering the key parameters and re-start news on each facility. Japan’s nuclear restart had ramped output back to 78TWH pa by 2023, and may rise by a further 100 TWH by 2030, to meet targets for 20% nuclear in…
-
Global oil demand: breakdown by product by country?
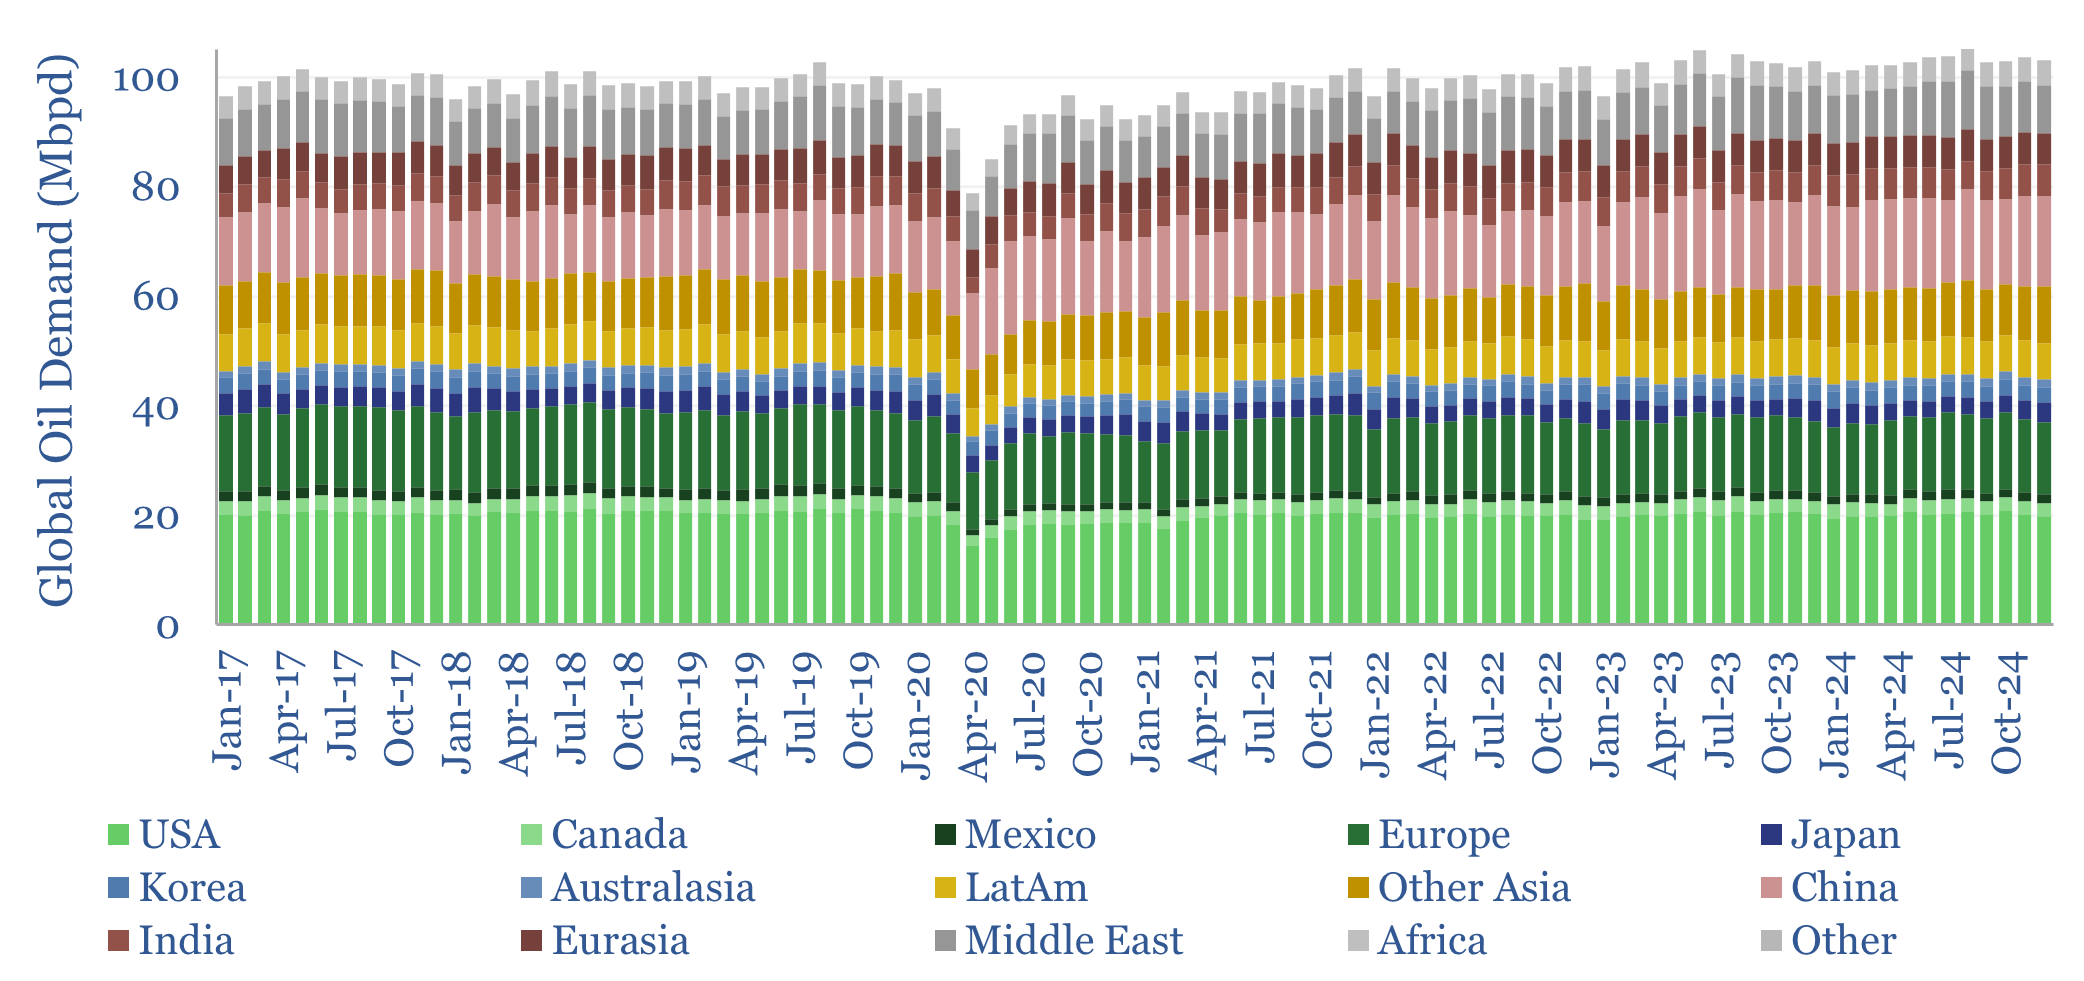
This data-file breaks down global oil demand, country-by-country, product-by-product, month-by-month, across 2017-2024. Global oil demand ran at 103 Mbpd in 2024, for +1.0 Mbpd of growth, according to our databases. For perspective, global oil demand rose at +1.2Mbpd per year in the 30-years from 1989->2019, so not much evidence, on face value, that “peak oil…
-
East to West: re-shoring the energy transition?
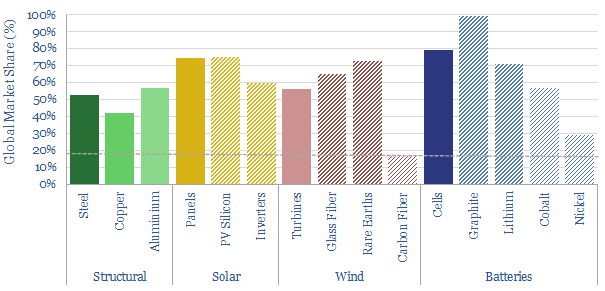
China is 18% of the world’s people and GDP. But it makes c50% of the world’s metals, 60% of its wind turbines, 70% of its solar panels and 80% of its lithium ion batteries. Re-shoring is likely to be a growing motivation after events of 2022. This 14-page note explores resultant opportunities.
-
FACTS of life: upside for STATCOMs & SVCs?
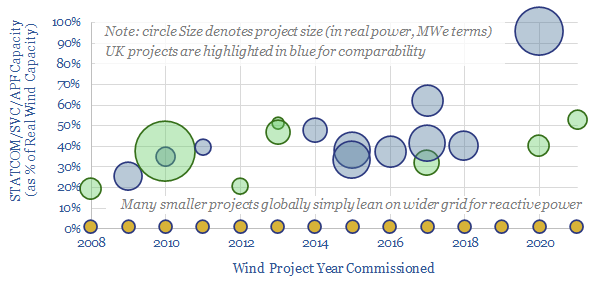
Wind and solar have so far leaned upon conventional power grids. But larger deployments will increasingly need to produce their own reactive power; controllably, dynamically. Demand for STATCOMs & SVCs may thus rise 30x, to over $25-50bn pa. This 20-page note outlines the opportunity and who benefits?
-
Air conditioning: energy demand sensitivity?
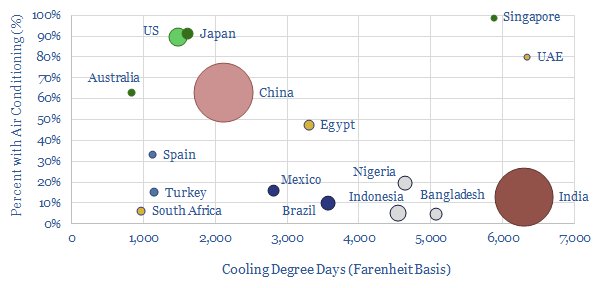
This data-file quantifies air conditioning energy demand. In the US each 100 variation in CDDs adds 26 TWH of electricity (0.6%) demand and 200bcf of gas (0.6%). Air conditioning already consumes 7% of all global electricity and could treble by 2050.
-
Silver producers: leading companies?
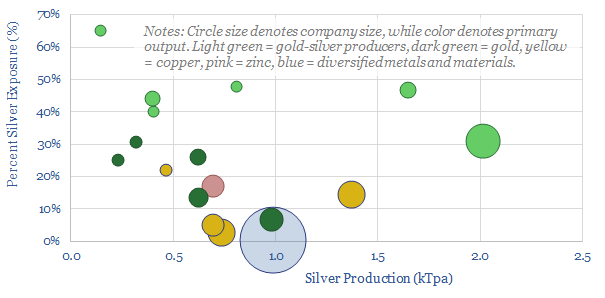
Half of the world’s 28kTpa global silver market is controlled by 17 public companies, with silver output ranging from 0.1 – 2.0 kTpa, and co-producing gold, copper or other metals. This data-file is a screen of silver producers, in order to identify leading companies.
-
Nostromo: thermal energy storage breakthrough?
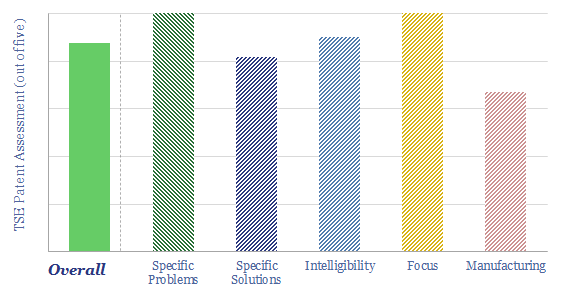
Nostromo is commercializing a thermal energy storage system, for commercial buildings in hot climates, where AC can comprise 40-70% of total energy use. It scores highly on our patent framework and can be an interesting alternative to lithium batteries.
-
Crop production: what CO2 intensity?
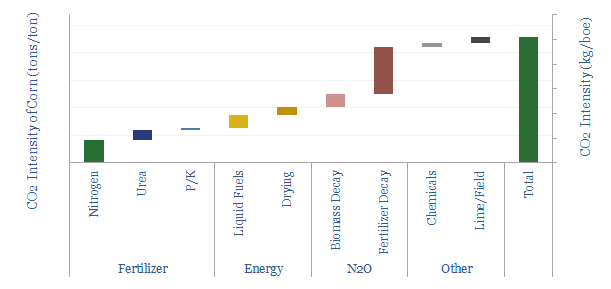
The CO2 intensity of producing corn averages 0.23 tons/ton, or 75kg/boe. 50% is from N2O emissions, a powerful greenhouse gas, from the breakdown of nitrogen fertilizer. Producing 1 kWh of food energy requires 9 kWh of fossil energy.
Content by Category
- Batteries (89)
- Biofuels (44)
- Carbon Intensity (49)
- CCS (63)
- CO2 Removals (9)
- Coal (38)
- Company Diligence (95)
- Data Models (840)
- Decarbonization (160)
- Demand (110)
- Digital (60)
- Downstream (44)
- Economic Model (205)
- Energy Efficiency (75)
- Hydrogen (63)
- Industry Data (279)
- LNG (48)
- Materials (82)
- Metals (80)
- Midstream (43)
- Natural Gas (149)
- Nature (76)
- Nuclear (23)
- Oil (164)
- Patents (38)
- Plastics (44)
- Power Grids (131)
- Renewables (149)
- Screen (117)
- Semiconductors (32)
- Shale (51)
- Solar (68)
- Supply-Demand (45)
- Vehicles (90)
- Wind (44)
- Written Research (356)