Data-centers: the economics?
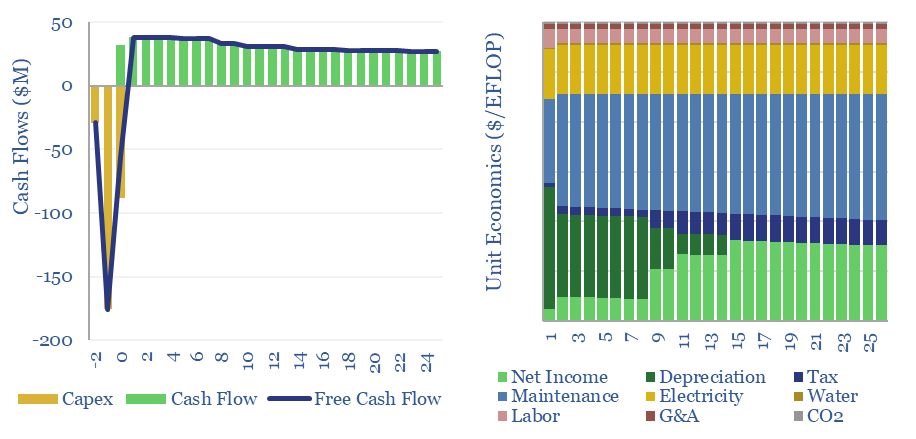
…the rise of AI, hence this model captures the costs of data-centers, from first principles, across capex, opex, land use and other input variables (see below). In 2023, the global…

…the rise of AI, hence this model captures the costs of data-centers, from first principles, across capex, opex, land use and other input variables (see below). In 2023, the global…
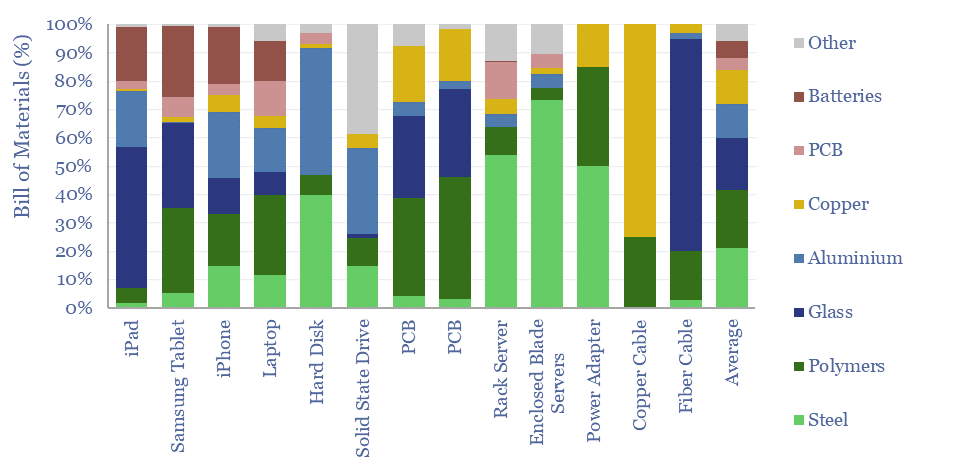
…could reduce copper use to 10 tons/MW, albeit this would still tighten global copper balances by around 1% per year through 2030. The ability to thrift out bulk material intensity…

…model has power rising from c40% to c50% of the US gas market by 2030, compensated by lower use in residential heat. https://thundersaidenergy.com/downloads/us-co2-and-methane-intensity-by-basin https://thundersaidenergy.com/downloads/gas-gathering-how-much-co2-and-methane https://thundersaidenergy.com/downloads/gas-pipelines-how-much-energy-co2-and-methane-leaks https://thundersaidenergy.com/downloads/gas-industry-co2-per-barrel https://thundersaidenergy.com/downloads/methane-leaks-from-downstream-gas-distribution https://thundersaidenergy.com/downloads/methane-slip-how-much-gas-evades-combustion https://thundersaidenergy.com/2019/12/15/global-gas-catch-methane-if-you-can https://thundersaidenergy.com/downloads/decarbonization-of-the-united-states-with-a-co2-price…
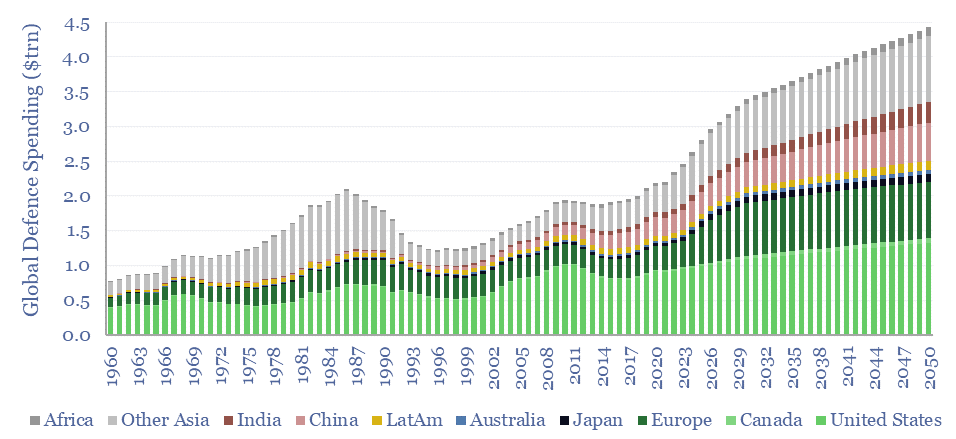
…our breakdowns of global GDP by region, and discussed on pages 3-4. If the world allocated $1trn pa more for defence by 2030, and $2trn pa more by 2050, then…
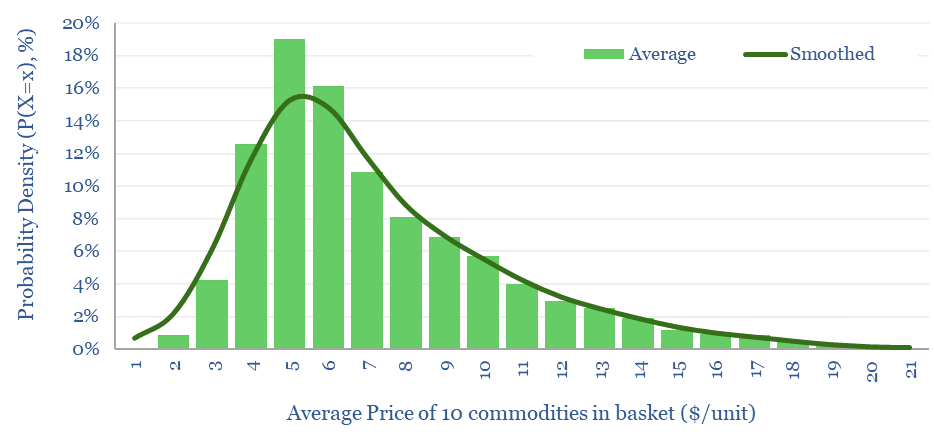
…than downside volatility. If base case forecasts are thought of as the median price levels of commodities (e.g., $65/bbl for oil over the past 50-years, $8/mcf for global gas, etc),…
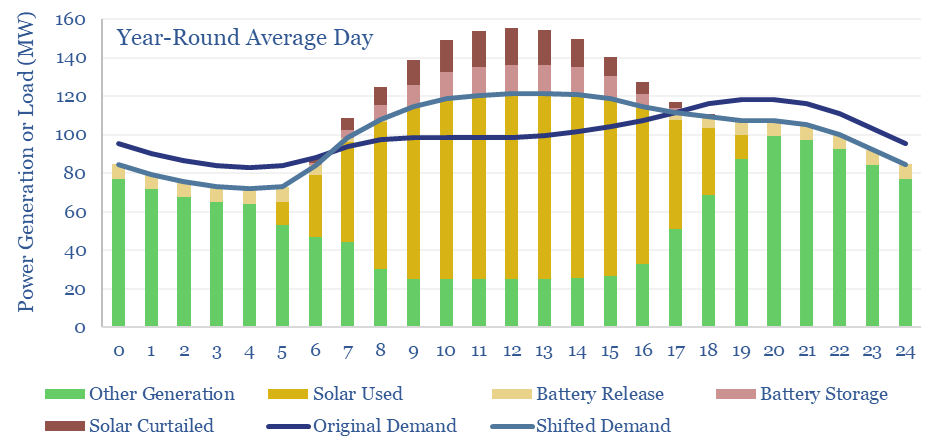
Can solar reach 45% of a power grid? This has been the biggest pushback on our recent report, scoring solar potential by country, where we argued the best regions globally…
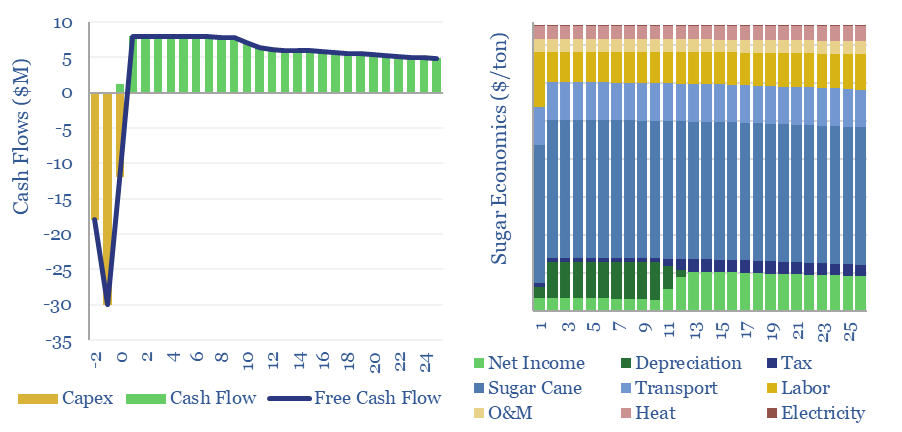
…sugar per day. This data-file captures the costs of sugar production. A sugar price of $260/ton is needed for a 10% IRR, on a MTpa-scale sugar refinery, while global sugar…
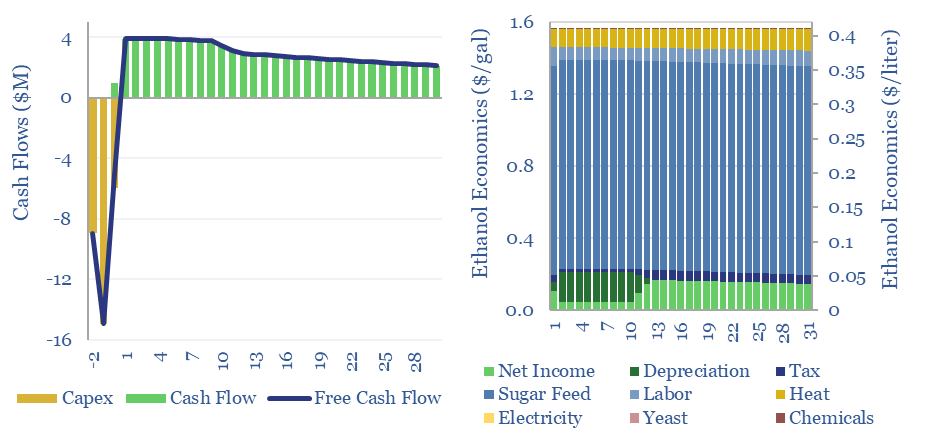
…CO2 intensity is at least 50% lower than hydrocarbons. $499.00 – Purchase Checkout Added to cart Global ethanol production runs to 2Mbpd of liquids, or around 28bn gallons per annum. Around two-thirds…
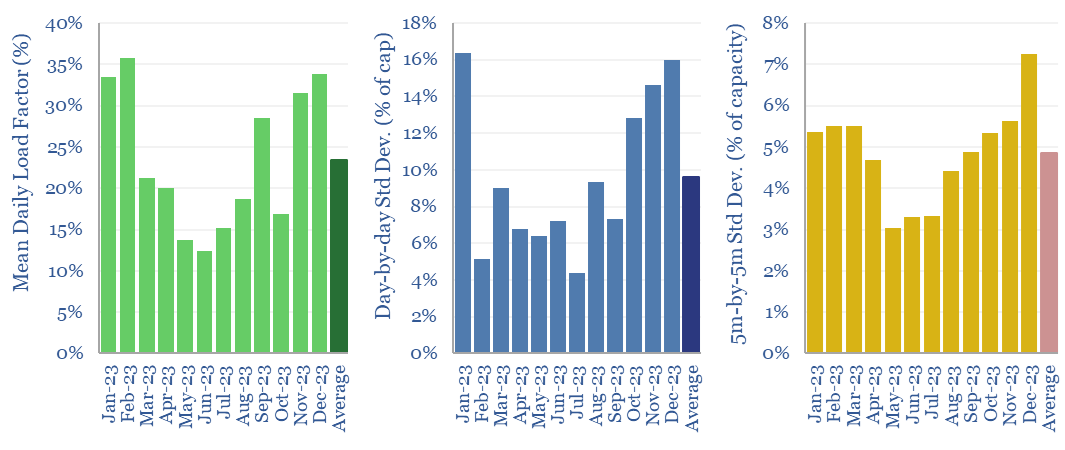
…is a nice way to visualize volatility. Conclusions are similar to other data-files we have compiled into solar volatility. We see increasing value in backstopping volatility across global energy systems….
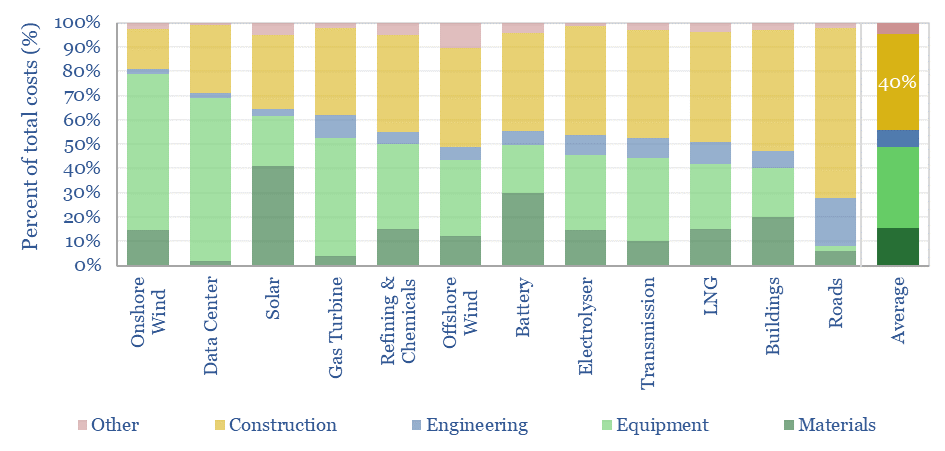
…sectors, those with the most specialized skill-sets, and those with particular specialization into power grid infrastructure. These companies are profiled on pages 9-10. $499.00 – Purchase Checkout Added to cart https://thundersaidenergy.com/2024/02/28/global-energy-capex-building-in-boom-times https://thundersaidenergy.com/downloads/engineering-and-construction-companies-screen…