Search results for: “LNG”
-
Commercial aviation: fuel economy of planes?
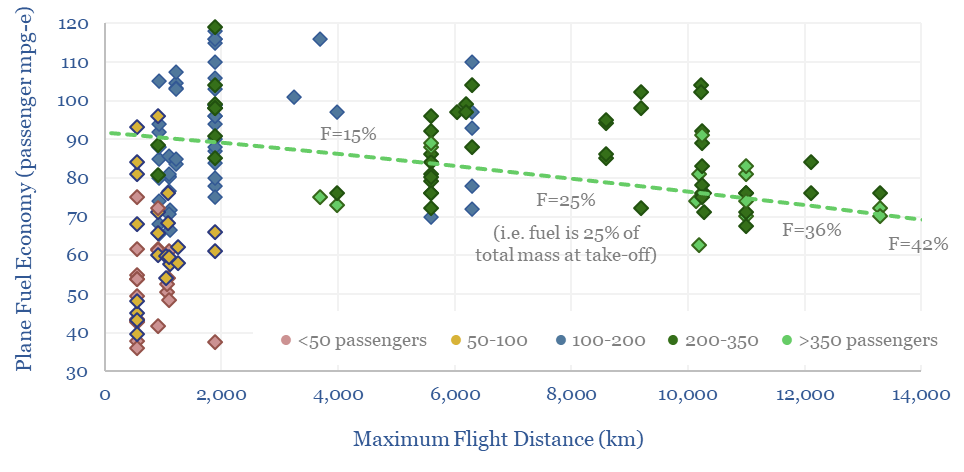
This data-file calculates the fuel economy of planes from first principles, using physics to calculate lift and drag, and comparing with actual data from aircraft manufacturers. The typical fuel economy of a plane is 80 passenger-mpg to carry 400 passengers, 8,000km at 900kmph, using jet fuel with 12,000 Wh/kg energy density. What sensitivities and decarbonization…
-
US shale: outlook and forecasts?
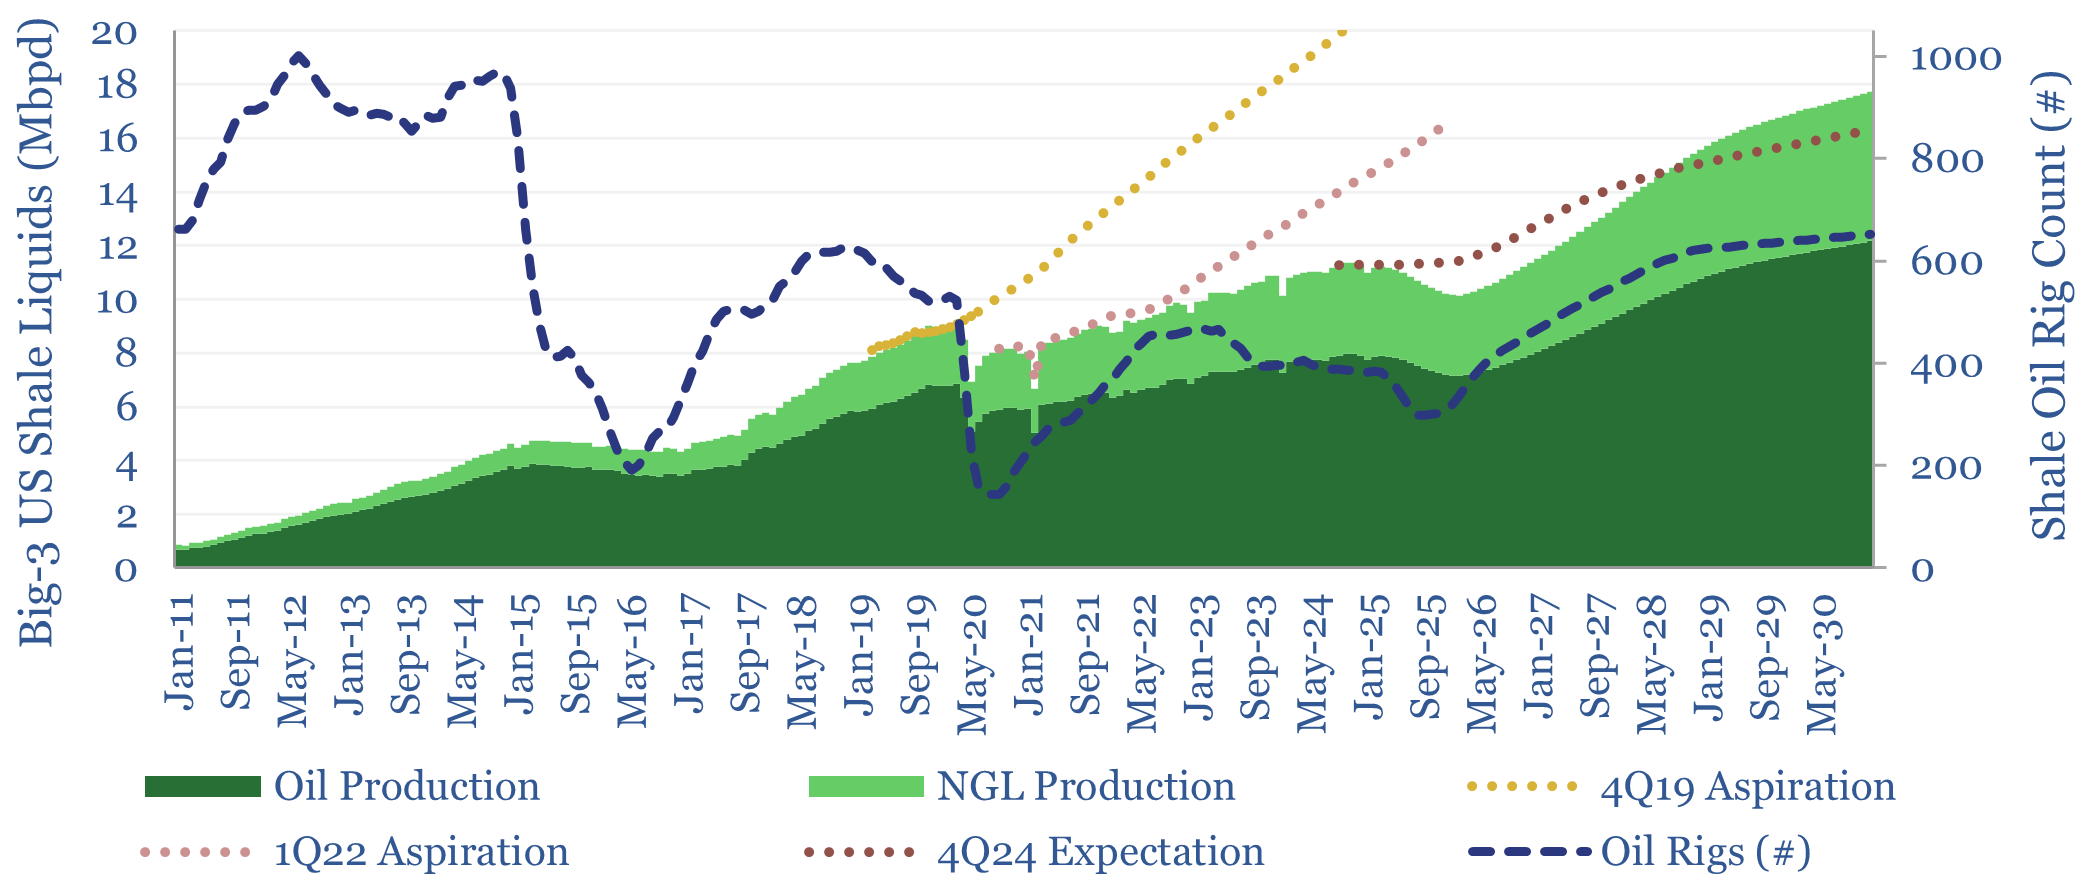
This model sets out our US shale production forecasts by basin. It covers the Permian, Bakken, Eagle Ford, Marcellus/Utica and Haynesville, as a function of the rig count, drilling productivity, completion rates, well productivity and type curves. The data-file was last updated in May-2025, revising liquids growth negative in 2025-26, which in turn tightens US…
-
Patent Leaders in Energy
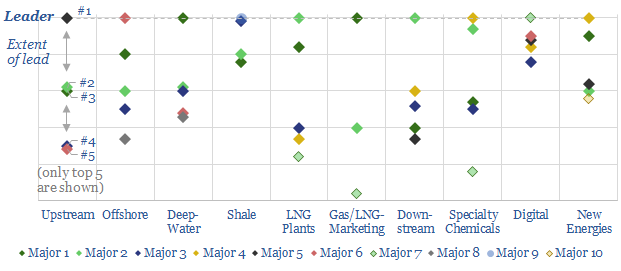
Technology leadership is crucial in energy. But it is difficult to discern. Hence, we reviewed 3,000 patents across the 25 largest companies. This note ranks the industry’s “Top 10 technology-leaders”: in upstream, offshore, deep-water, shale, LNG, gas-marketing, downstream, chemicals, digital and renewables. In each case, we profile the leading company, its edge and the proximity…
-
Hybrid horizons: industrial use of batteries?
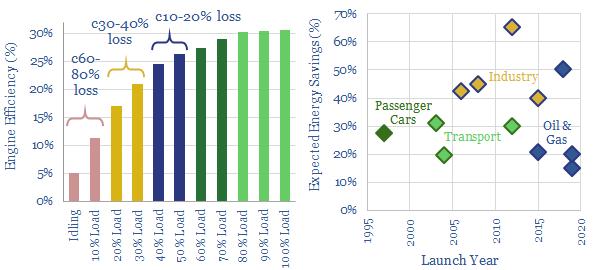
Gas and diesel engines can be 30-80% less efficient when idling, or running at low loads. This is the rationale for hybridizing engines with backup batteries. Industrial applications are increasing, achieving 30-65% efficiency gains, across multiple industries. In 2018-19, the biggest new horizon has been in oil and gas, including hybrid rigs, supply vessels, construction…
-
Global gas: catch methane if you can?
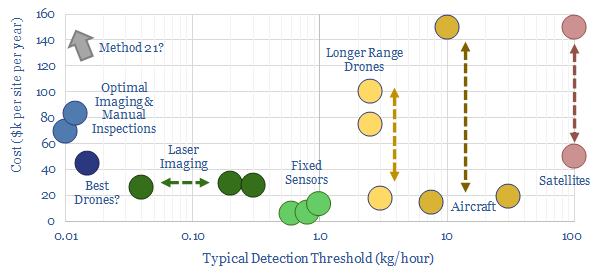
Scaling up natural gas is the largest decarbonisation opportunity on the planet. But this requires minimising methane leaks. Exciting new technologies are emerging. This note ranks producers, positions for new policies and advocates developing more LNG. To seize the opportunity, we also identify early-stage companies in methane measurement and mature public companies in the oilfield…
-
Gas power: levelized costs of combined cycle gas turbines?
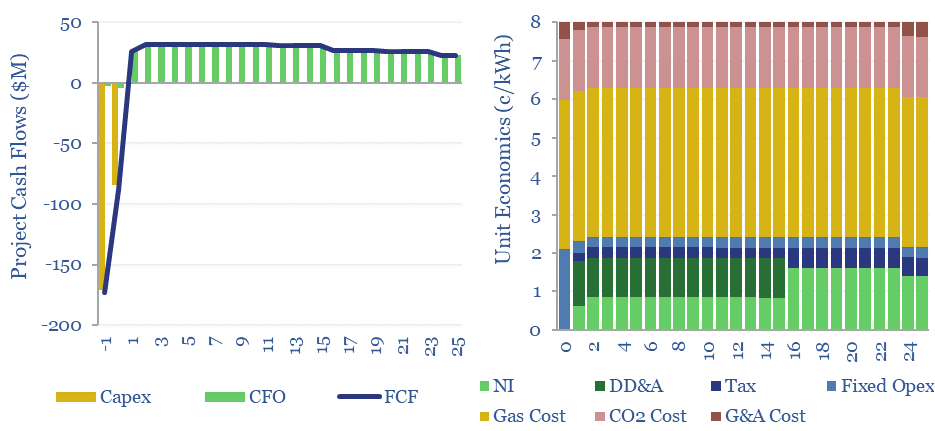
Levelized costs of combined cycle gas turbines are built up in this data-file. Our base case costs of gas-fired power generation are 8c/kWh, at a combined cycle turbine converting 55% of the thermal energy of natural gas into electrical energy, for a total CO2 intensity of 0.35 kg/kWh.
-
Platform supply vessels: what contribution to CO2?
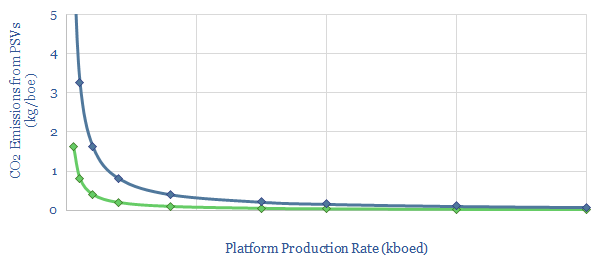
This data-file calculates the contribution of Platform Supply Vessels (PSVs) to an oil and gas asset’s emissions. Our base case estimate is 0.1kg/boe for a productive asset in a well-developed basin. Numbers rise 4x in a remote basin, and by another c4x for smaller fields. 1kg/boe is possible. These emissions can be lowered by 10-20% through…
-
Upstream technology leaders: weathering the downturn?
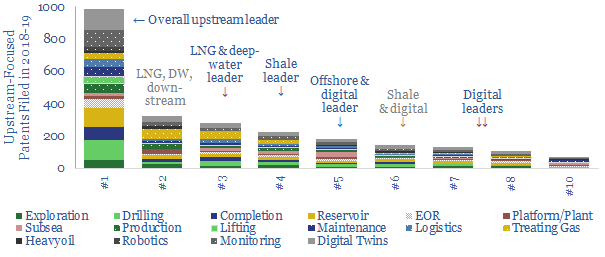
Leading technologies correlate 50-80% with ROACEs and -88% with costs in the energy industry. Hence, we assessed 6,000 patents from 2018-19, to determine which Energy Majors are best-placed to weather the downturn, benefit from dislocation and thrive in the recovery. We find clear leaders in onshore, offshore, shale, LNG and digital.
-
Energy infrastructure: labor intensity?
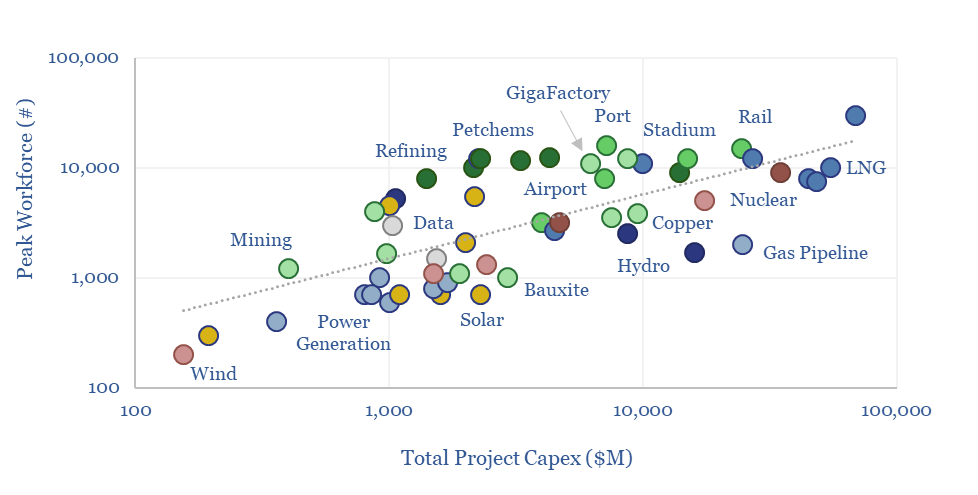
How many jobs are created by different types of energy? This data-file aggregates the labor intensity of different energy sources, which average 50-150 workers per TWH, on an ongoing basis. Another rough rule of thumb is that each $1bn of capex requires 1,000 peak constructon workers, although some project categories are materially more labor intensive…
-
Fuel costs and CO2 intensities?
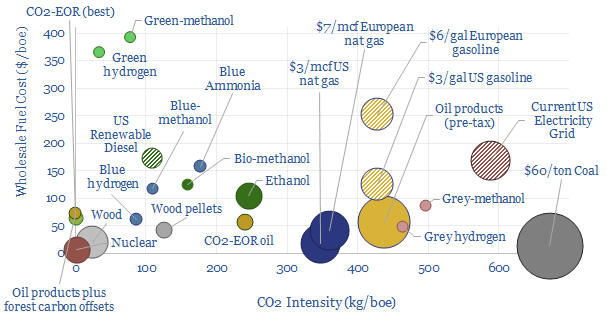
We have produced a cross-plot of the costs and CO2 intensities of different fuels, in $/boe and kg of CO2 per boe, to compre the relative attractiveness of decarbonization options. Favored decarbonization options are nature based solutions, CO2-EOR, blue hydrogen and coal-to-gas switching.
Content by Category
- Batteries (88)
- Biofuels (44)
- Carbon Intensity (49)
- CCS (63)
- CO2 Removals (9)
- Coal (38)
- Company Diligence (93)
- Data Models (831)
- Decarbonization (159)
- Demand (110)
- Digital (58)
- Downstream (44)
- Economic Model (203)
- Energy Efficiency (75)
- Hydrogen (63)
- Industry Data (278)
- LNG (48)
- Materials (82)
- Metals (77)
- Midstream (43)
- Natural Gas (148)
- Nature (76)
- Nuclear (23)
- Oil (164)
- Patents (38)
- Plastics (44)
- Power Grids (127)
- Renewables (149)
- Screen (114)
- Semiconductors (30)
- Shale (51)
- Solar (67)
- Supply-Demand (45)
- Vehicles (90)
- Wind (43)
- Written Research (351)