Search results for: “climate model”
-
Commercial aviation: fuel economy of planes?
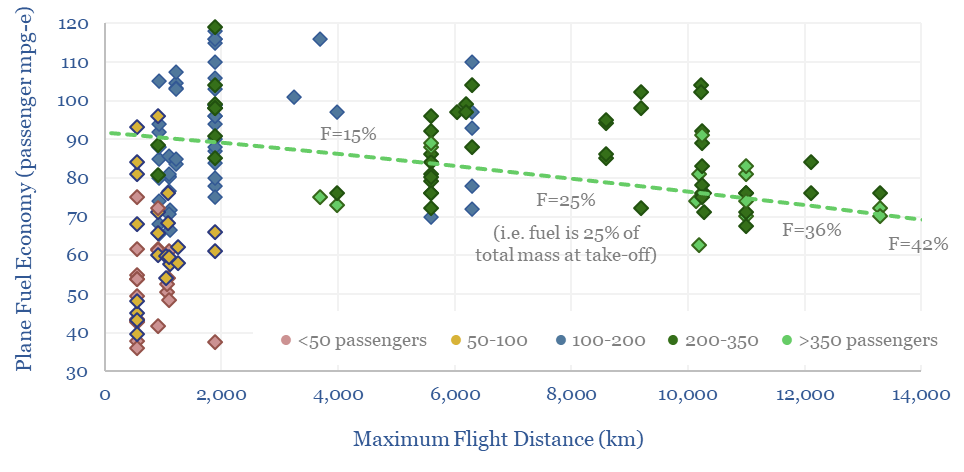
This data-file calculates the fuel economy of planes from first principles, using physics to calculate lift and drag, and comparing with actual data from aircraft manufacturers. The typical fuel economy of a plane is 80 passenger-mpg to carry 400 passengers, 8,000km at 900kmph, using jet fuel with 12,000 Wh/kg energy density. What sensitivities and decarbonization…
-
Energy Economics of e-Scooters
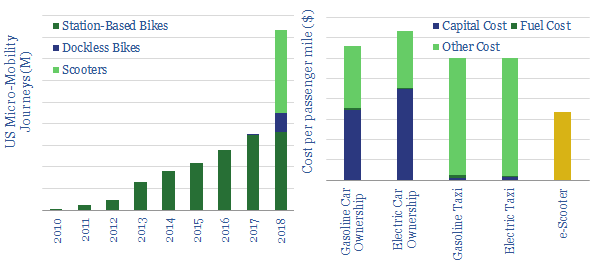
This workbook contains all our modelling on the energy economics of e-scooters; a transformational technology for urban mobility. Included are our projections of per-mile costs, energy-economics, battery charging times, new electricity demand and displacement of oil demand.
-
Power Trains? Electric, diesel or hydrogen
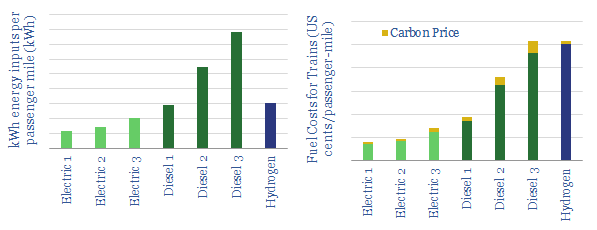
This data-file compares diesel trains, electric trains and hydrogen trains, according to their energy consumption, carbon emissions and fuel costs. The energy economics are best for electrifying rail-lines. Hydrogen costs must deflate 25-75% to be cost-competitive.
-
Long-Term LNG Demand: technology-led?
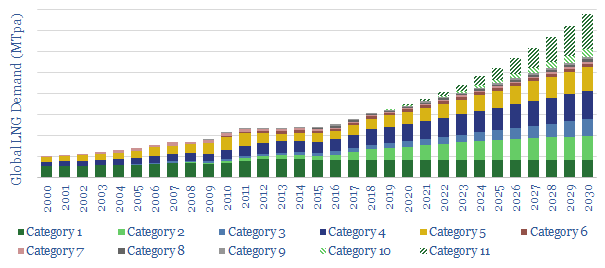
This is a simple model of long-term LNG demand, extrapolating out sensible estimates for the world’s leading LNG-consumers. On top of this, we overlay the upside from two nascent technology areas, which could add 200MTpa of potential upside to the market. Backup workings are included.
-
Drone Delivery: the Energy Economics
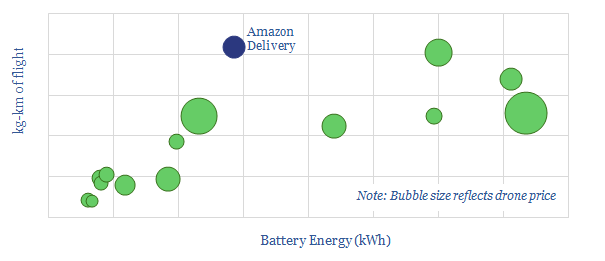
We have tabulated energy economics on 15 commercial drones and run the equations of flight on Amazon’s “Prime Air” solution. We conclude that drone delivery will use 90% less energy, 99% less cost and 90% lower carbon than is typical in current last-mile truck deliveries. Please download the model for all of the numbers.
-
Distribution Costs: Ships, Trucks, Trains and Delivery Vans?
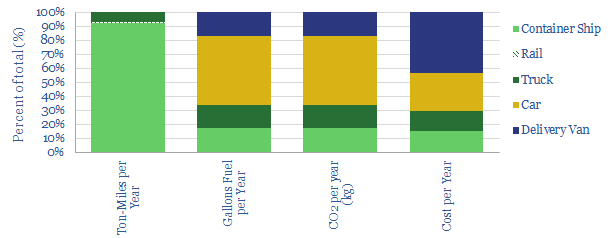
Distributing goods to the typical US consumer costs 1.5bbls of fuel, 600kg of CO2 and $1,000 per annum. The costs will increase 20-40% in the next decade, as the share of online retail doubles to c20%, hence new technologies are needed in last-mile delivery. This data-file provides a full breakdown of the numbers, across container-ships,…
-
Investing for an Energy Transition
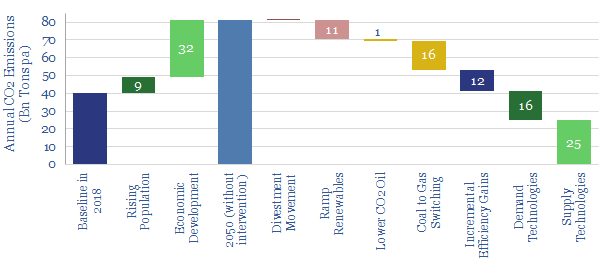
What is the best way for investors to drive decarbonisation? We argue a new ‘venturing’ model is needed, to incubate better technologies. CO2 budgets can also be stretched furthest by re-allocating to gas, lower-carbon oil and lower-carbon industry. But divestment is a grave mistake.
-
Ramping Renewables: Portfolio Perspectives?
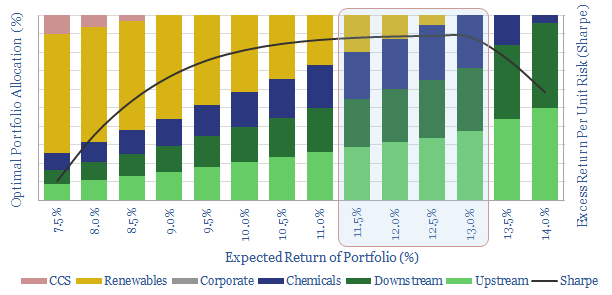
It is often said that Oil Majors should transition to renewables and become Energy Majors. But what is the best balance based on modern portfolio theory? Our 7-page paper answers this question by constructing a mean-variance optimisation model. We find a c0-20% weighting to renewables can maximise risk-adjusted returns. 5-13% is ideal. But beyond a…
-
Methane emissions detract from natural gas?
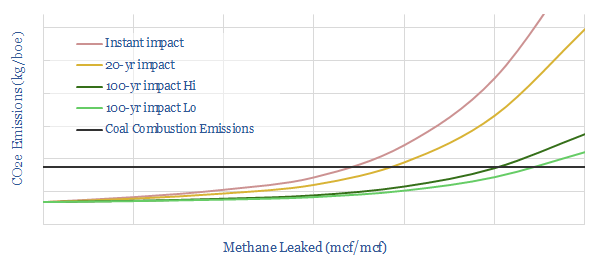
With methane emissions fully controlled, burning gas is c60% lower-CO2 than burning coal. However, taking natural gas to cause 120x more warming than CO2 over a short timeframe, the crossover (where coal emissions and gas emissions are equivalent) is 4% methane intensity. The gas industry must work to mitigate methane.
-
CO2 intensity of shale: breakdown by category?
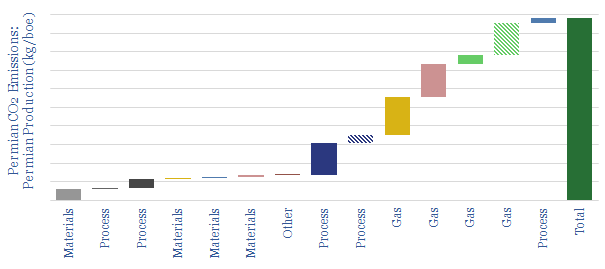
This model disaggregates the CO2 emissions of producing shale oil, across 14 different contributors: such as materials, drilling, fracturing, supply chain, lifting, processing, methane leaks and flaring. CO2 intensity can be flexed by changing the input assumptions. Our ‘idealized shale’ scenario follows in a separate tab, showing how Permian shale production could become ‘carbon neutral’.
Content by Category
- Batteries (89)
- Biofuels (44)
- Carbon Intensity (49)
- CCS (63)
- CO2 Removals (9)
- Coal (38)
- Company Diligence (94)
- Data Models (838)
- Decarbonization (160)
- Demand (110)
- Digital (59)
- Downstream (44)
- Economic Model (204)
- Energy Efficiency (75)
- Hydrogen (63)
- Industry Data (279)
- LNG (48)
- Materials (82)
- Metals (80)
- Midstream (43)
- Natural Gas (148)
- Nature (76)
- Nuclear (23)
- Oil (164)
- Patents (38)
- Plastics (44)
- Power Grids (130)
- Renewables (149)
- Screen (117)
- Semiconductors (32)
- Shale (51)
- Solar (68)
- Supply-Demand (45)
- Vehicles (90)
- Wind (44)
- Written Research (354)