Search results for: “gas”
-
Global CO2 emissions breakdown?
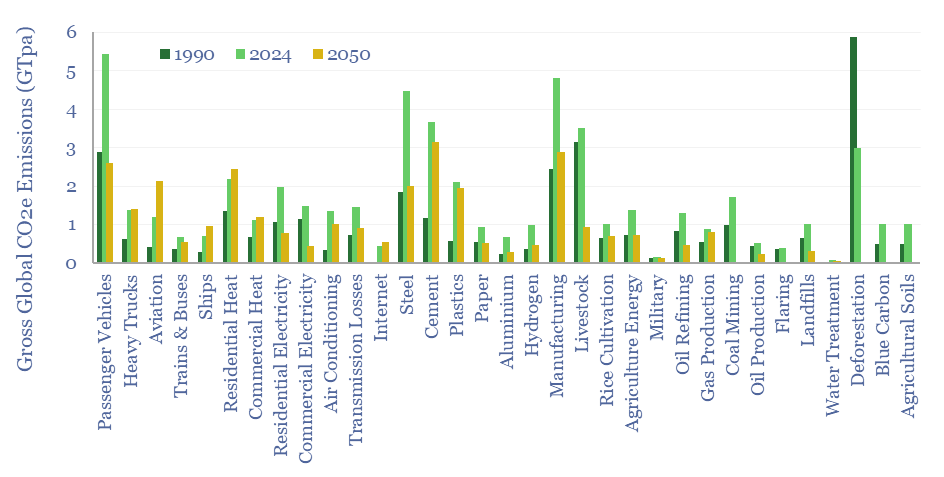
Global CO2 emissions rose from 32GTpa of CO2-equivalents in 1990 to 54GTpa in 2024, and are seen optimistically declining to 30GTpa by 2050, on a gross basis. This global CO2 emisisons breakdown covers 33 sources that each explain over 0.5% of global CO2e emissions, as a way of tracking emissions by source, by year, and…
-
Global Flaring Intensity by Country
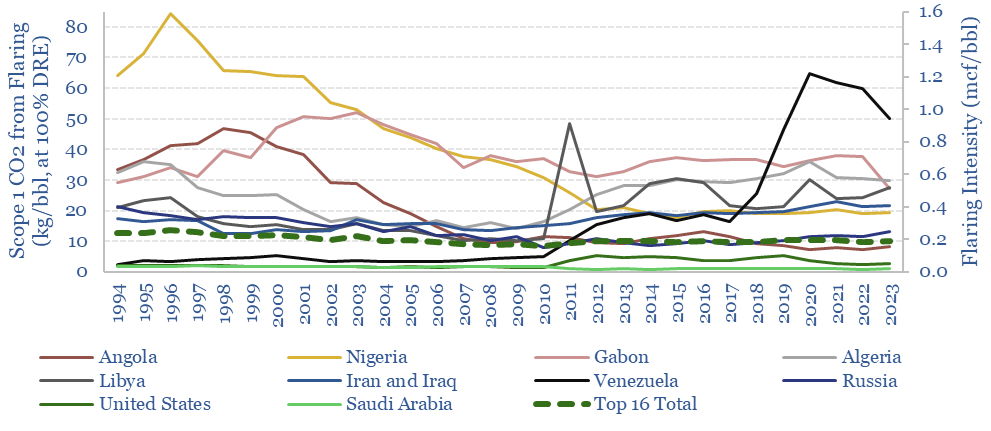
This data-file tabulates global flaring intensity in 16 countries: in absolute terms (bcm per year), per barrel of oil production (mcf/bbl) and as a contribution to CO2 emissions (kg/boe). 2021 saw 144bcm of global flaring, averaging 0.2 mcf/bbl and 10 kg/boe of direct emissions. Lower decile countries flared 0.7 mcf/bbl, which is over 40 kg/boe.
-
Northern Lights CCS: the economics?
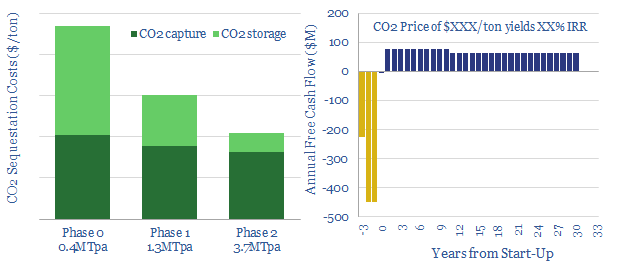
We have modeled out simple economics for Northern Lights, the most elaborate CCS scheme proposed by the energy industry (Equinor, Shell, TOTAL). The project involves capturing 1.3-1.5MTpa of industrial CO2, shipping it, piping it 110km offshore, then injecting it 3,000m below Norway’s seabed. Costs are expensive. But phase 2 could benefit from scale, offering “CO2…
-
Carbon Capture Costs at Refineries?
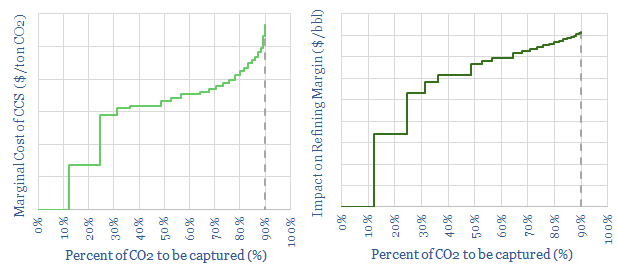
Refineries emit 1bn tons pa of CO2, or around 30kg per bbl of throughputs. Hence this model tests the relative costs of retro-fitting carbon capture and storage (CCS), to test the economic impacts. c10-20% of emissions will be lowest-cost to capture. The middle c50% will cost c3x more. But the final 25% could cost up…
-
US Refining: energy and CO2 intensity
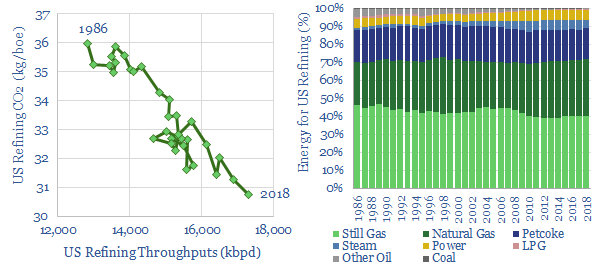
Emissions of refining a barrel of crude in the US has fallen at a 0.5% CAGR over the past c30-years, from 36kg/boe in 1986 to 31kg/boe in 2018. US refineries are also increasingly fueled by natural gas and merchant steam, while own use of oil, coal and oil products have been phased out.
-
US Refinery Database: CO2 intensity by facility?
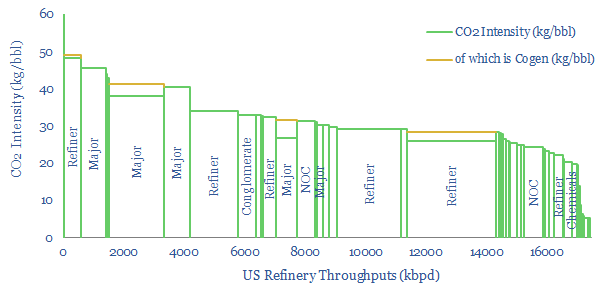
This US refinery database covers 125 US refining facilities, with an average capacity of 150kbpd, and an average CO2 intensity of 33 kg/bbl. Upper quartile performers emitted less than 20 kg/bbl, while lower quartile performers emitted over 40 kg/bbl. The goal of this refinery database is to disaggregate US refining CO2 intensity by company and…
-
Shell: the future of LNG plants?
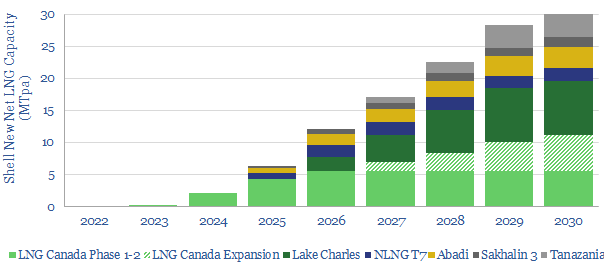
Shell is revolutionizing LNG project design, based on reviewing 40 of the company’s gas-focused patents from 2019. The innovations can lower LNG facilities’ capex by 70% and opex by 50%; conferring a $4bn NPV and 4% IRR advantage over industry standard greenfields. Smaller-scale LNG, modular LNG and highly digitized facilities are particularly abetted. This note…
-
Solar power: the economics?
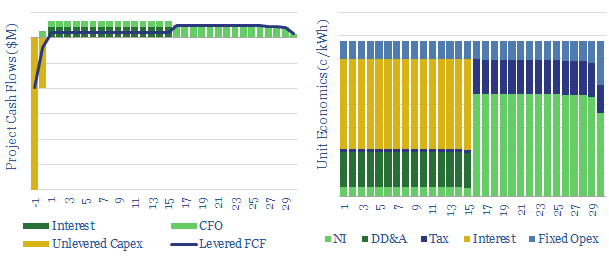
Levelized costs of solar electricity are estimated at 7c/kWh in our base case, but can realistically range from 4-40c/kWh. This data-file is a breakdown of solar costs, as a function of capex, opex, insolation, curtailment and decline rates. Solar can be highly competitive, up to 35-50% of many power grids.
-
Can carbon-neutral fuels re-shape the oil industry?
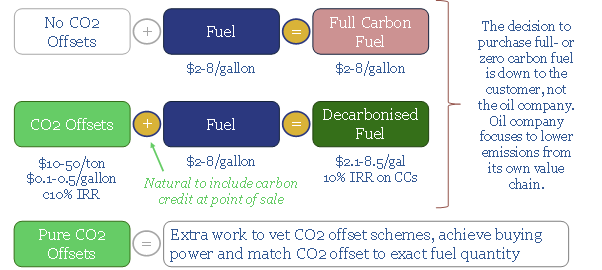
Fuel retailers have a game-changing opportunity seeding new forests. They could offset c15bn tons of CO2 per annum, enough to accommodate 85Mbpd of oil and 400TCF of annual gas use in a fully decarbonized energy system. The cost is competitive, well below c$50/ton. It is natural to sell carbon credits alongside fuels and earn a…
-
Energy Costs of Constructing Solar Assets
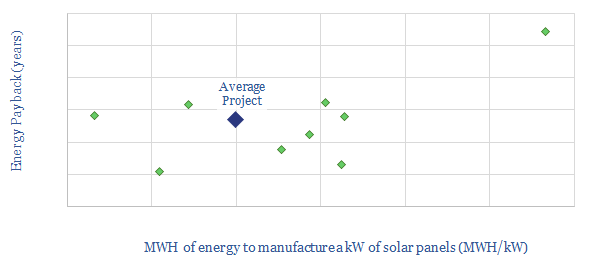
This data-file quantifies the energy costs of manufacturing solar panels, based on 10 studies and prior projects. We see the average solar project requiring 5MWH/kW, with a 2.3-year energy payback, a c10x energy-return on energy-invested and CO2-intensity of 90kg/boe (for contrast, average oil is c440kg/boe and average gas is c350kg/boe).
Content by Category
- Batteries (89)
- Biofuels (44)
- Carbon Intensity (49)
- CCS (63)
- CO2 Removals (9)
- Coal (38)
- Company Diligence (95)
- Data Models (840)
- Decarbonization (160)
- Demand (110)
- Digital (60)
- Downstream (44)
- Economic Model (205)
- Energy Efficiency (75)
- Hydrogen (63)
- Industry Data (279)
- LNG (48)
- Materials (82)
- Metals (80)
- Midstream (43)
- Natural Gas (149)
- Nature (76)
- Nuclear (23)
- Oil (164)
- Patents (38)
- Plastics (44)
- Power Grids (130)
- Renewables (149)
- Screen (117)
- Semiconductors (32)
- Shale (51)
- Solar (68)
- Supply-Demand (45)
- Vehicles (90)
- Wind (44)
- Written Research (354)