Search results for: “power electronics”
-
Global power price volatility tracker?
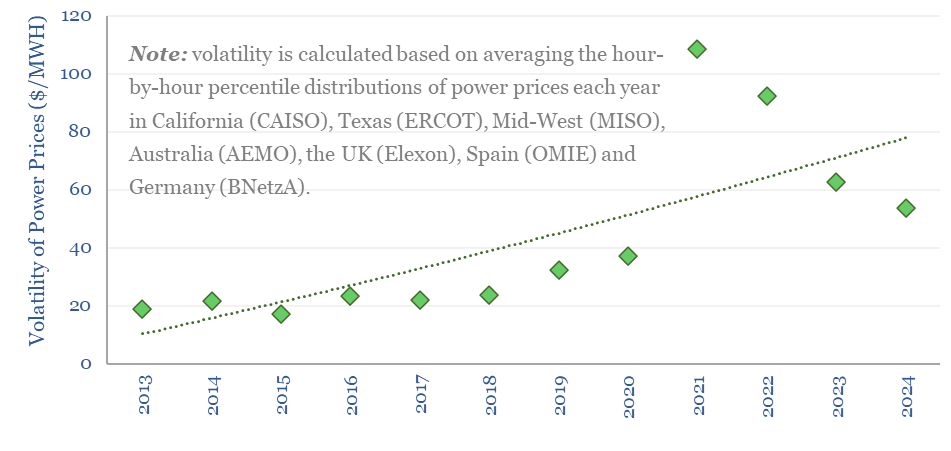
The volatility of power grids has doubled over the past decade from 2013-2024. This data-file tracks the percentile-by-percentile distributions of power prices, each year, in seven major grid regions (Texas, California, US MidWest, Australia, the UK, Germany, and Spain), as a way of tracking increases in global power price volatility. The growing volatility of power…
-
Water intensity of power generation?
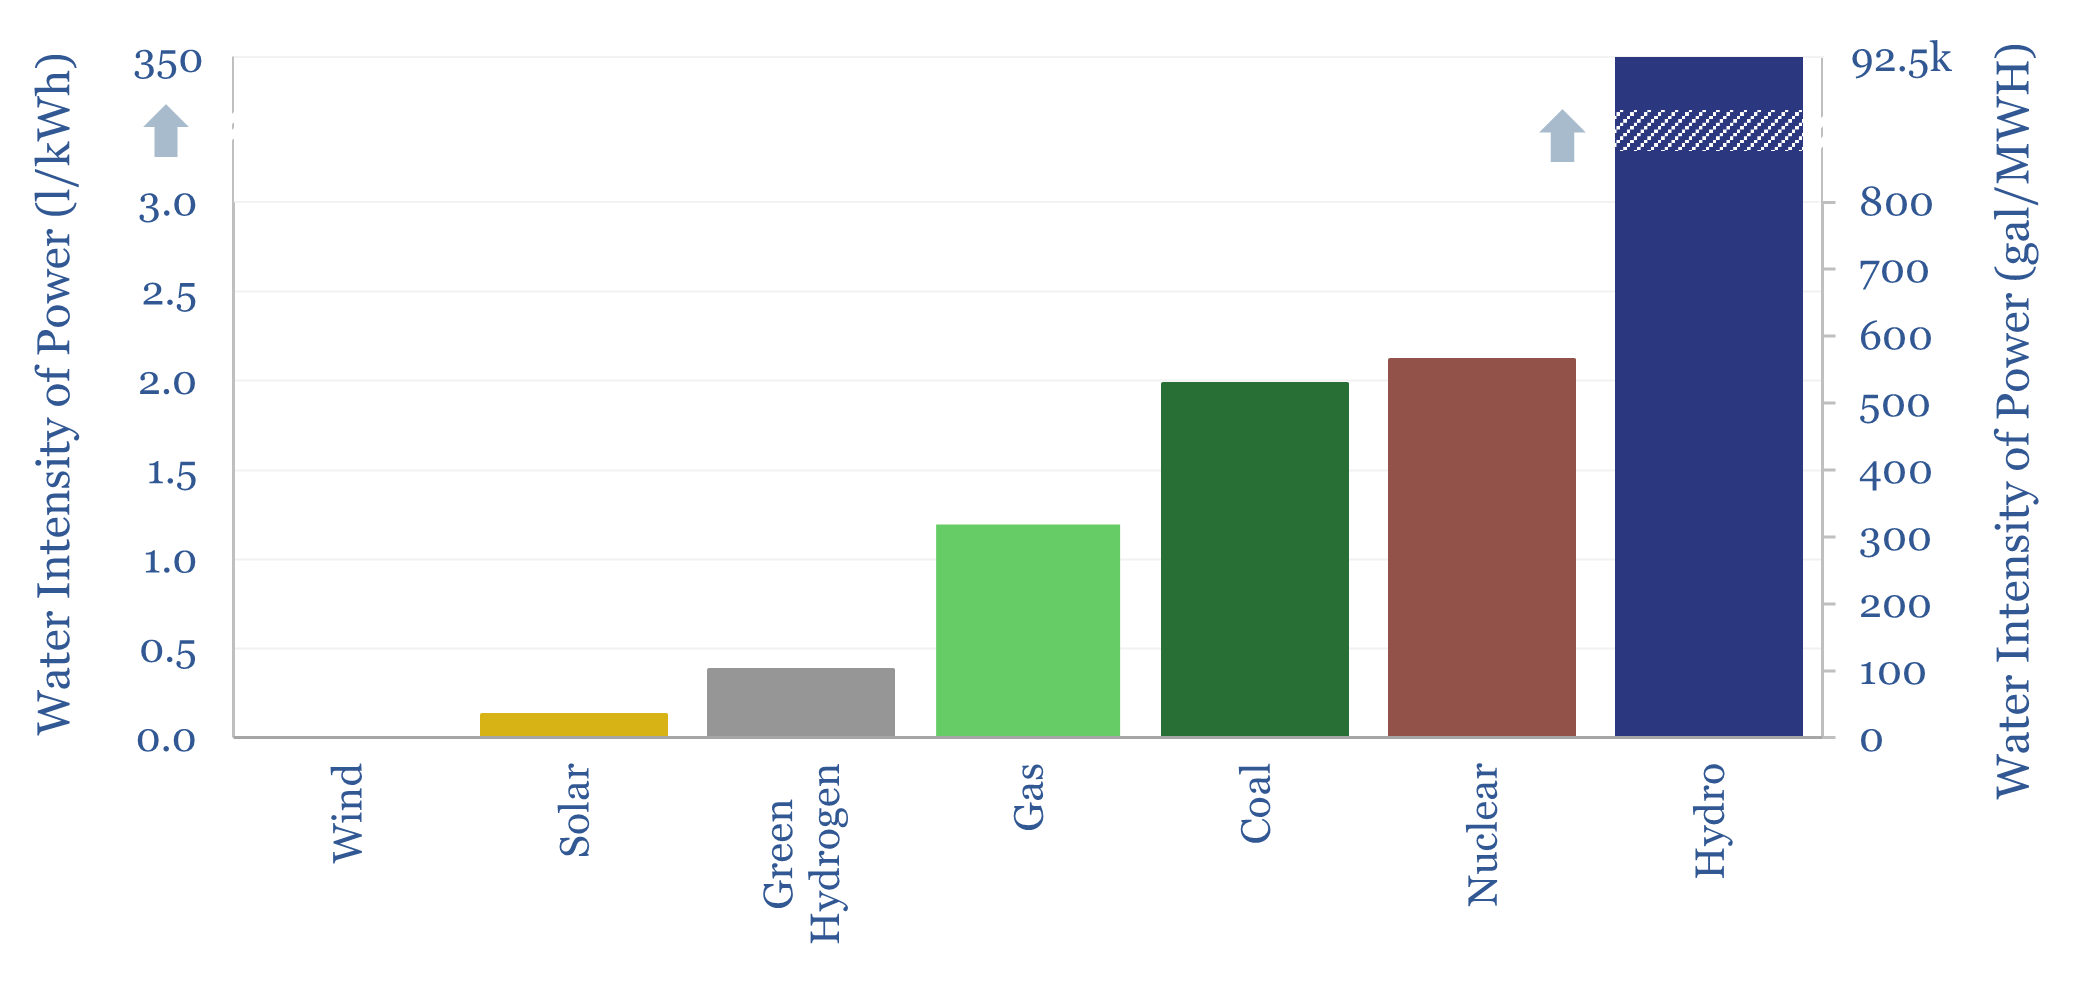
The water intensity of US power generation averages 21 liters per kWh (5,600 gallons per MWH), but 95% of this total comes from evaporation at hydro reservoirs. Excluding hydro power, good estimates are that nuclear power uses 2.1 liters/kWh of water, coal power uses 2 liters/kWh and CCGTs use 1.2 liters/kWh, or less in some…
-
Power grids: transmission and distribution kilometers by country?
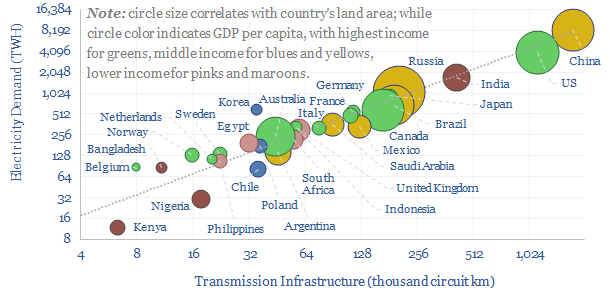
This data-file aggregates power transmission and distribution kilometers by country, across 30 key countries, which comprise 80% of global electricity use. In 2023, the world contains 7M circuit kilometers of power transmission lines and 110M kilometers of power distribution lines. Useful rules of thumb are in the data-file.
-
Diesel power generation: levelized costs?
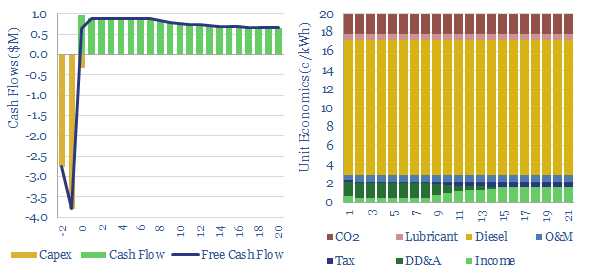
A multi-MW scale diesel generator requires an effective power price of 20c/kWh, in order to earn a 10% IRR, on c$700/kW capex, assuming $70 oil prices and c150km trucking of oil products to the facility. Economics can be stress-tested in the Model-Base tab.
-
Thermal power plant: loss attribution?
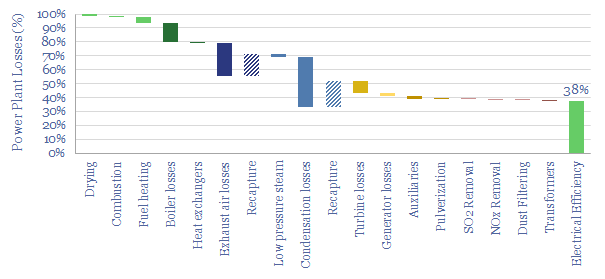
This data-file is a simple loss attribution for a thermal power plant. For example, a typical coal-fired power plant might achieve a primary efficiency of 38%, converting thermal energy in coal into electrical energy. Our loss attribution covers the other 62% using simple physics and industry average data-points.
-
Ideal Power: Bi-Directional Bipolar Junction Transistors?
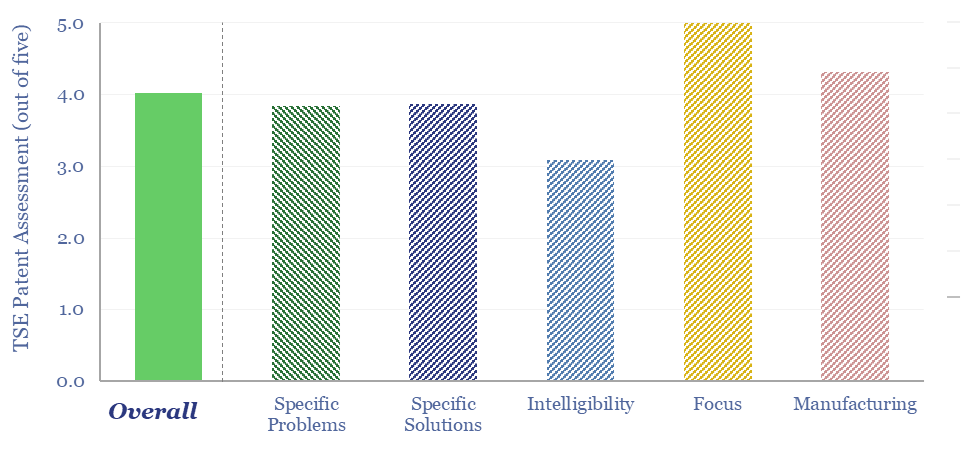
Bi-Directional Bipolar Junction Transistors are an emerging category of semiconductor-based switching device, that can achieve lower on-state voltage drops than MOSFETs and softer, faster switching than IGBTs, to improve efficiency and lower component count in bi-directional power converters. This data-file screens B-TRAN patents from Ideal Power.
-
Electric vehicle cost breakdown by component?
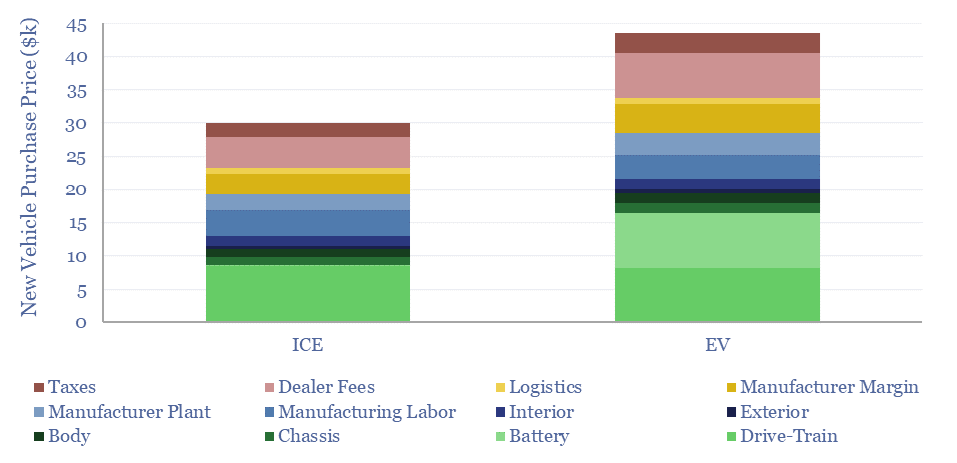
This data-file disaggregates the $30k total cost of a typical new ICE and the c$45k total cost of a typical new EV, as a sum-of-the-parts, across 25 cost lines. Drivetrain costs are similar at $8-9k each. The key challenge for the EV is the battery. The electric vehicle cost breakdown shows promise for improving power…
-
Solar capacity: growth through 2030 and 2050?
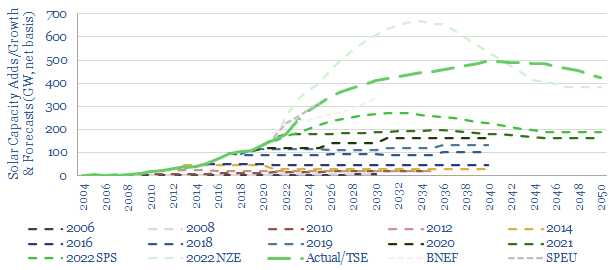
Forecasts for future solar growth have an unsatisfyingly uncertain range, varying by 3x. Hence this 15-page note discusses the future of solar. Solar capacity additions likely accelerate 3.5x by 2030 and 5x by 2040. But this creates bottlenecks, including for seven materials; and requires >$1trn pa of additional power grid capex plus $1trn pa of…
-
Offshore wind: installation vessels and time per turbine?
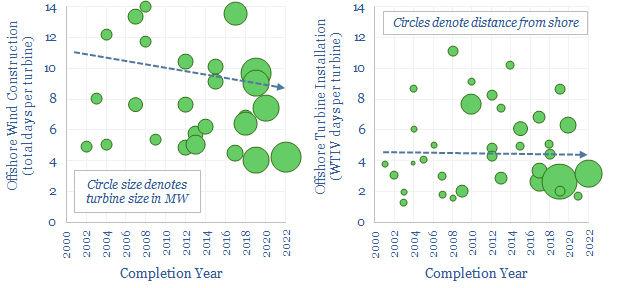
Wind turbine installation vessels are estimated to cost $100-500/kW in the breakdown of a typical offshore wind project’s capex. Total offshore construction time is around 10 days per turbine. Wind turbine installation vessel use averages around 5 days per turbine. Data from past projects are tabulated in this data-file.
-
US gas power: generation by facility over time?
US gas power generation by facility is broken down in this data-file, across 1,850 active gas-power plants, supplying 40% of all US electricity. Descriptive statistics are available in the summary tab, a state-by-state breakdown follows in the PlantsByState tab and underlying data on all 3,000 historical facilities are provided in the AllGasPlants tab.
Content by Category
- Batteries (87)
- Biofuels (42)
- Carbon Intensity (49)
- CCS (63)
- CO2 Removals (9)
- Coal (38)
- Company Diligence (92)
- Data Models (822)
- Decarbonization (159)
- Demand (110)
- Digital (58)
- Downstream (44)
- Economic Model (200)
- Energy Efficiency (75)
- Hydrogen (63)
- Industry Data (275)
- LNG (48)
- Materials (81)
- Metals (74)
- Midstream (43)
- Natural Gas (146)
- Nature (76)
- Nuclear (23)
- Oil (162)
- Patents (38)
- Plastics (44)
- Power Grids (124)
- Renewables (149)
- Screen (112)
- Semiconductors (30)
- Shale (51)
- Solar (67)
- Supply-Demand (45)
- Vehicles (90)
- Wind (43)
- Written Research (347)