US gas power generation by facility is broken down in this data-file, across 2,300 active gas-power plants, supplying 40% of all US electricity. Descriptive statistics are available in the summary tab, a state-by-state breakdown follows in the PlantsByState tab and underlying data on all 3,000 historical facilities are provided in the AllGasPlants tab.
The US contains 575GW of gas-fired power plants, across 2,300 active facilities, supplying 40% of all US electricity, per our US gas and power model. Underlying data on each facility are available within the EIA’s electricity market data.
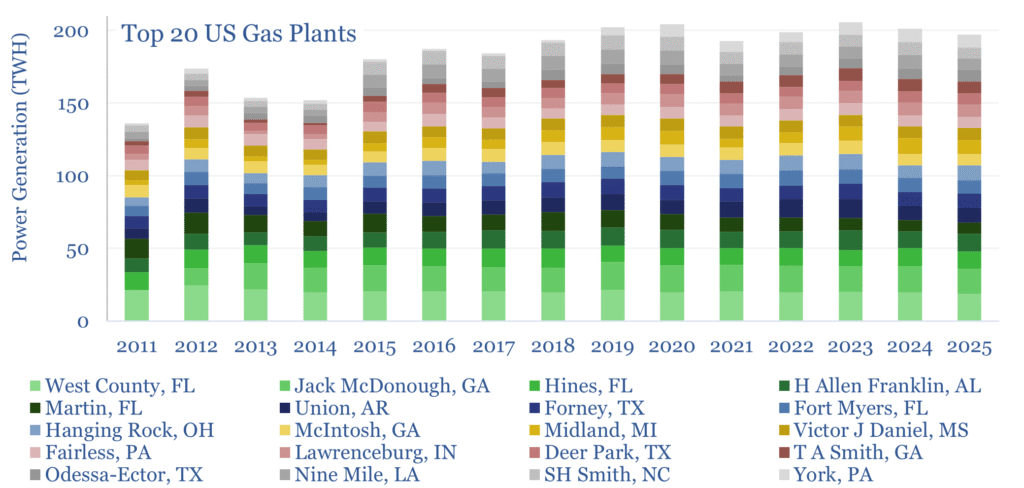
Hence this data-file captures 3,000 gas-fired power plants in the US, going back historically to 2001, with generation data for each facility. The top 20 largest facilities are shown below and comprise 11% of US gas generation in 2025.
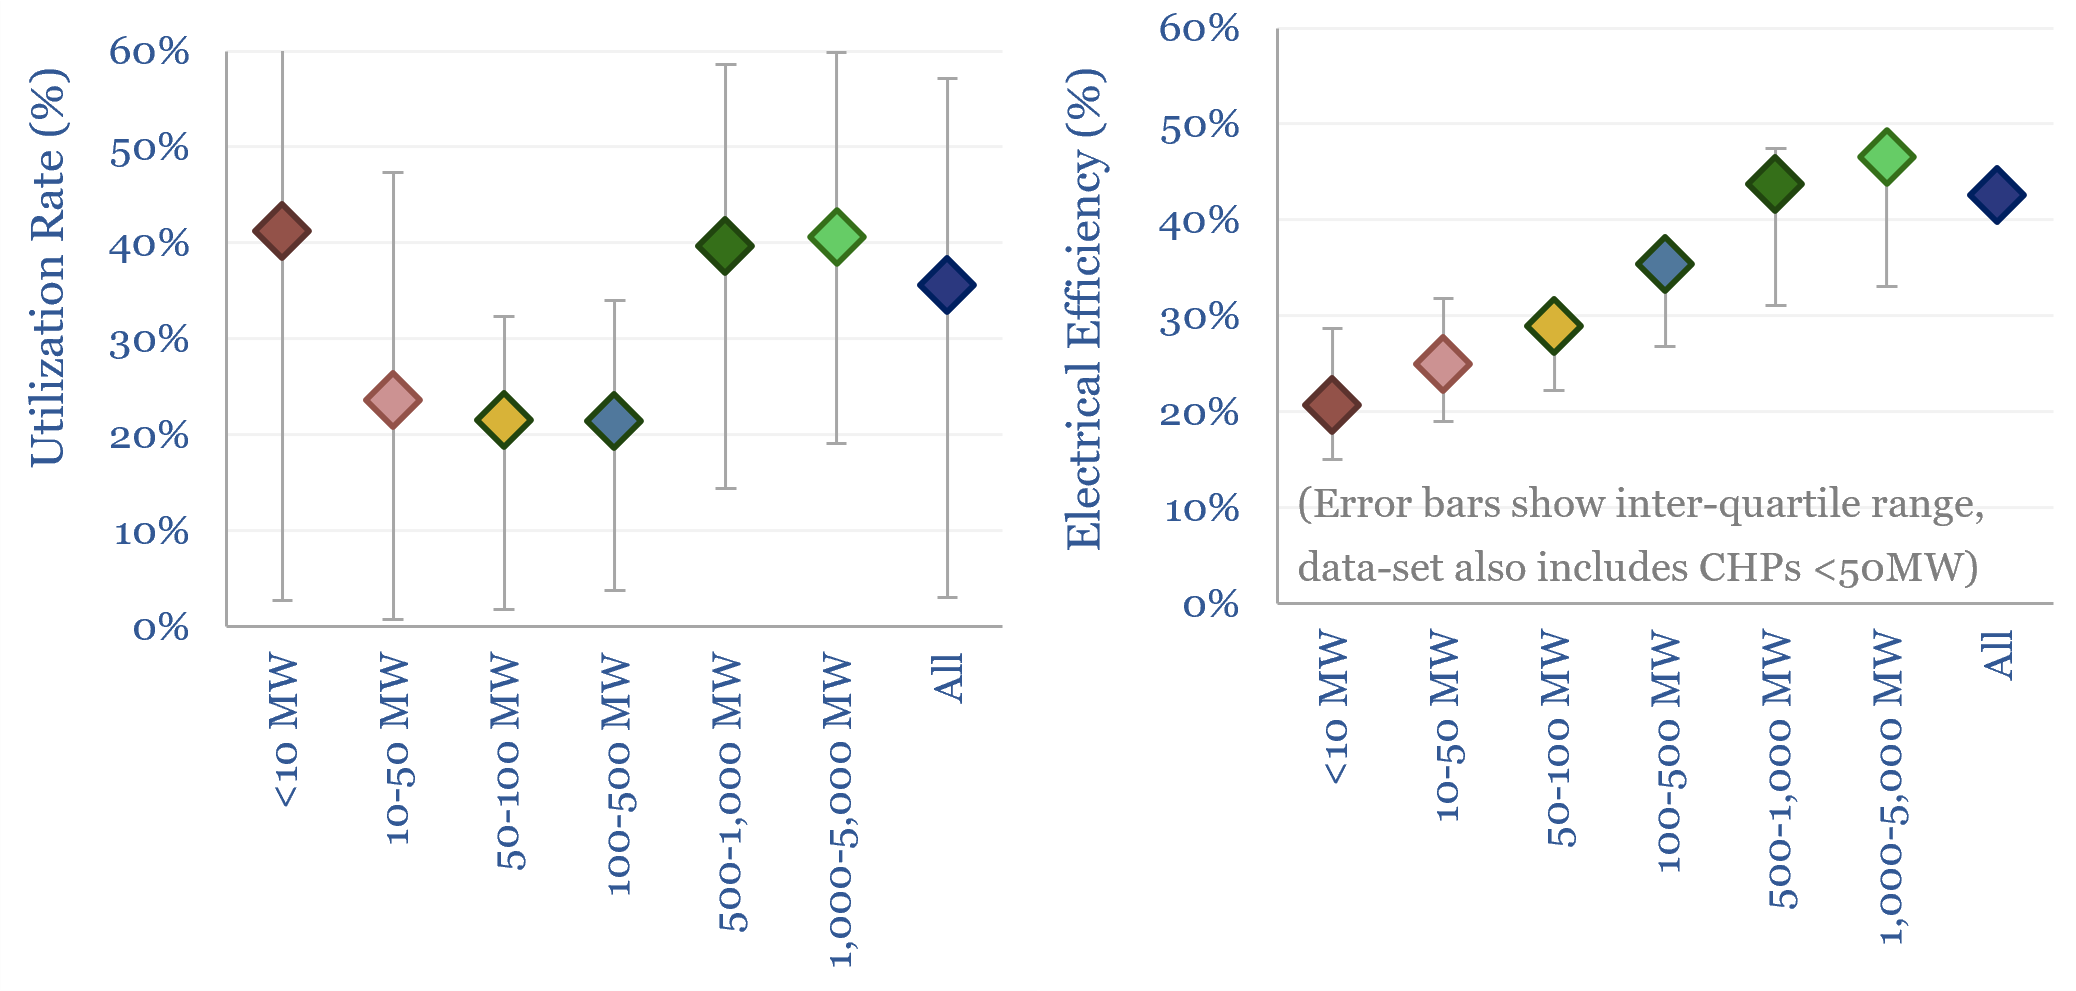
Across all US gas power generation by facility, 35% are <10MW, 25% are 10-100MW, 20% are 100-500MW, 20% are >500MW. But the large >500MW plants are 75% of US gas capacity and 85% of US gas generation.
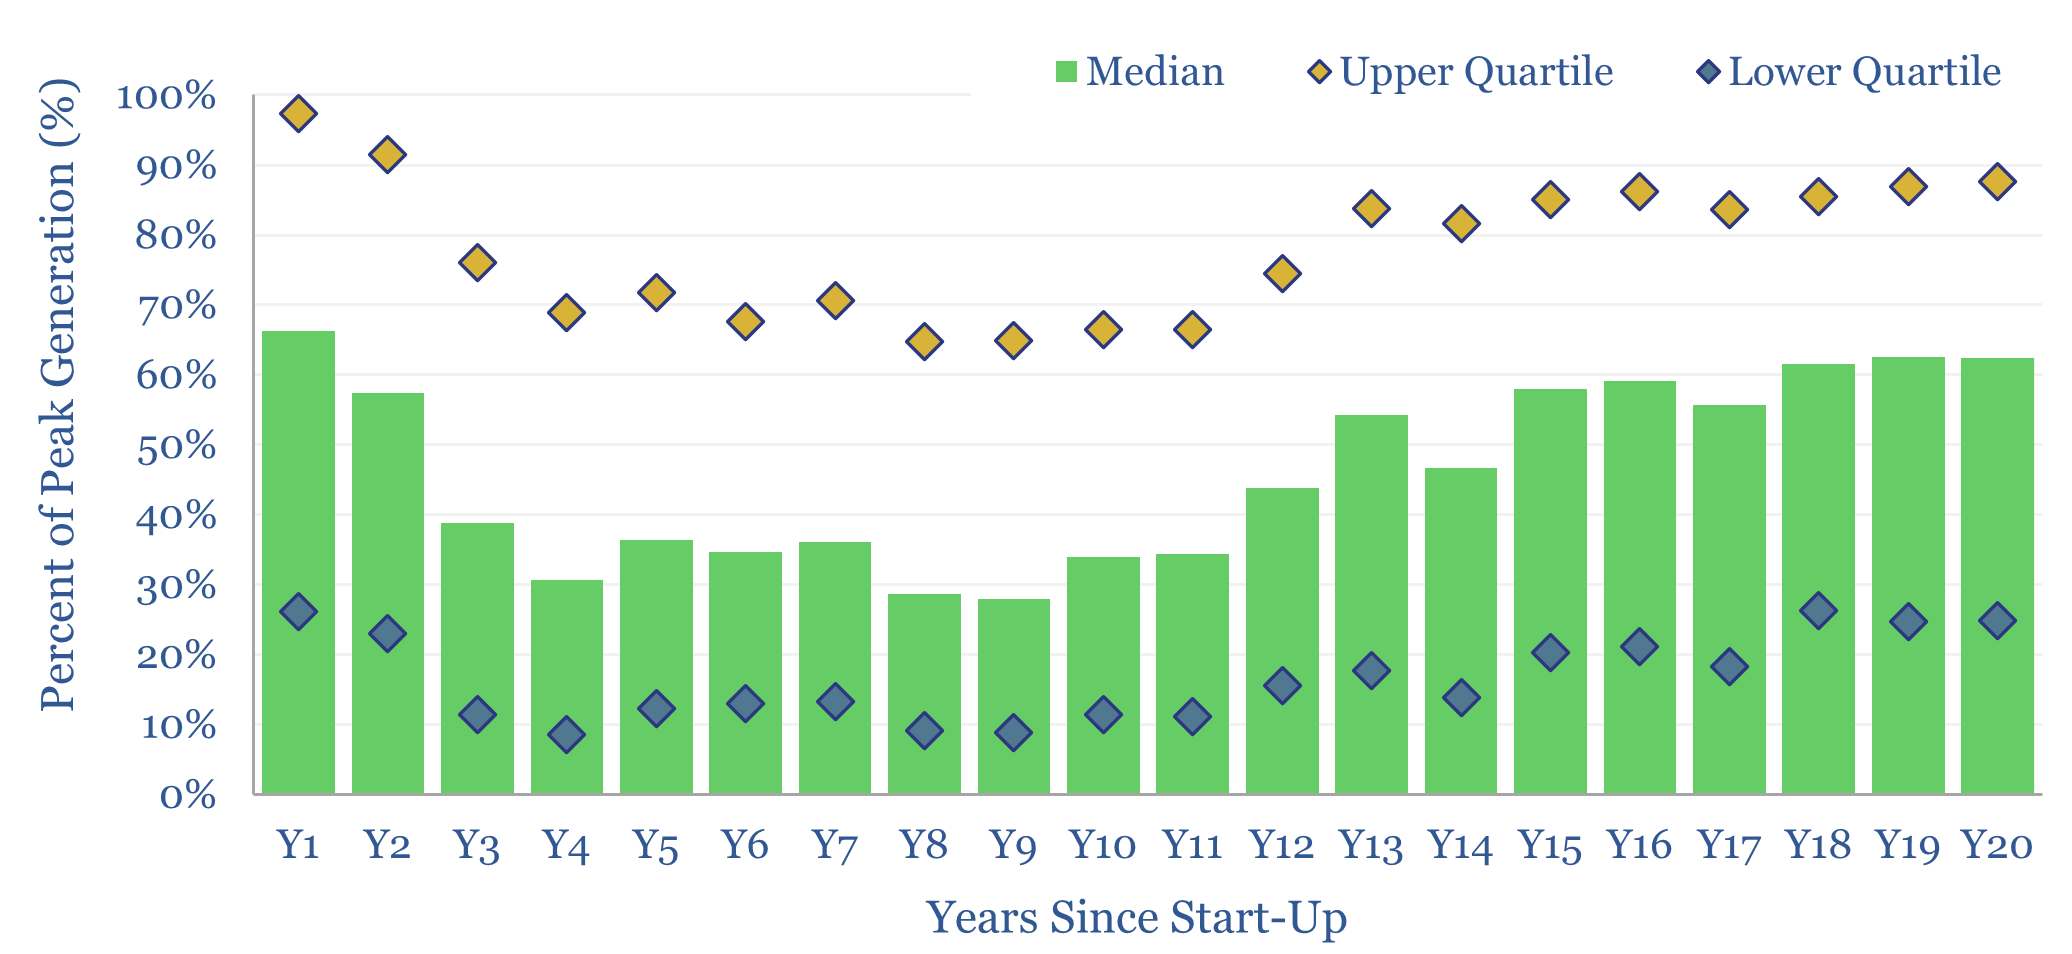
The average annual utilization rate is 40%. The average annual efficiency factor is 45%. There is effectively no decline rate across these assets (unlike solar declines and wind declines),
Conversely, the average annual output of typical US gas generation facilities is intentionally flexed by +/- 30% each year (inter-quartile range) depending on the demand for power (chart below). Likewise, gas production is flexed voluntarily. The ability to flex becomes increasingly valuable as energy markets grow more volatile.
Gas power is flexible and efficient, providing a backbone to the US grid. A key conclusion in our recent research is that natural gas power entrenches as a backstop to wind and solar, in increasingly renewables-heavy grids (note below). We also see this in other geographies such as Australia.
However, US gas-fired generation actually fell by -3% YoY, to 1,804 TWH in 2025. This data-point is surprising. 2x more facilities saw YoY output declines than saw YoY output gains, both across the broader sample, and the top twenty plants shown above. The chart even raises the question whether US gas plant utilization rates, which rose steadily from 2011->19 amidst shale gas, are now starting to decline, due to rising competition from solar additions.
The gas-generation data by facility also help to evaluate whether new loads entering the grid — such as the rise of AI or the rise of EVs — could be accommodated simply by drawing on the spare capacity in gas-fired power plants, and without having to build new CCGTs or expanding gas turbine manufacturing capacity.