Search results for: “shale”
-
Power plant cooling: adapting for water scarcity?
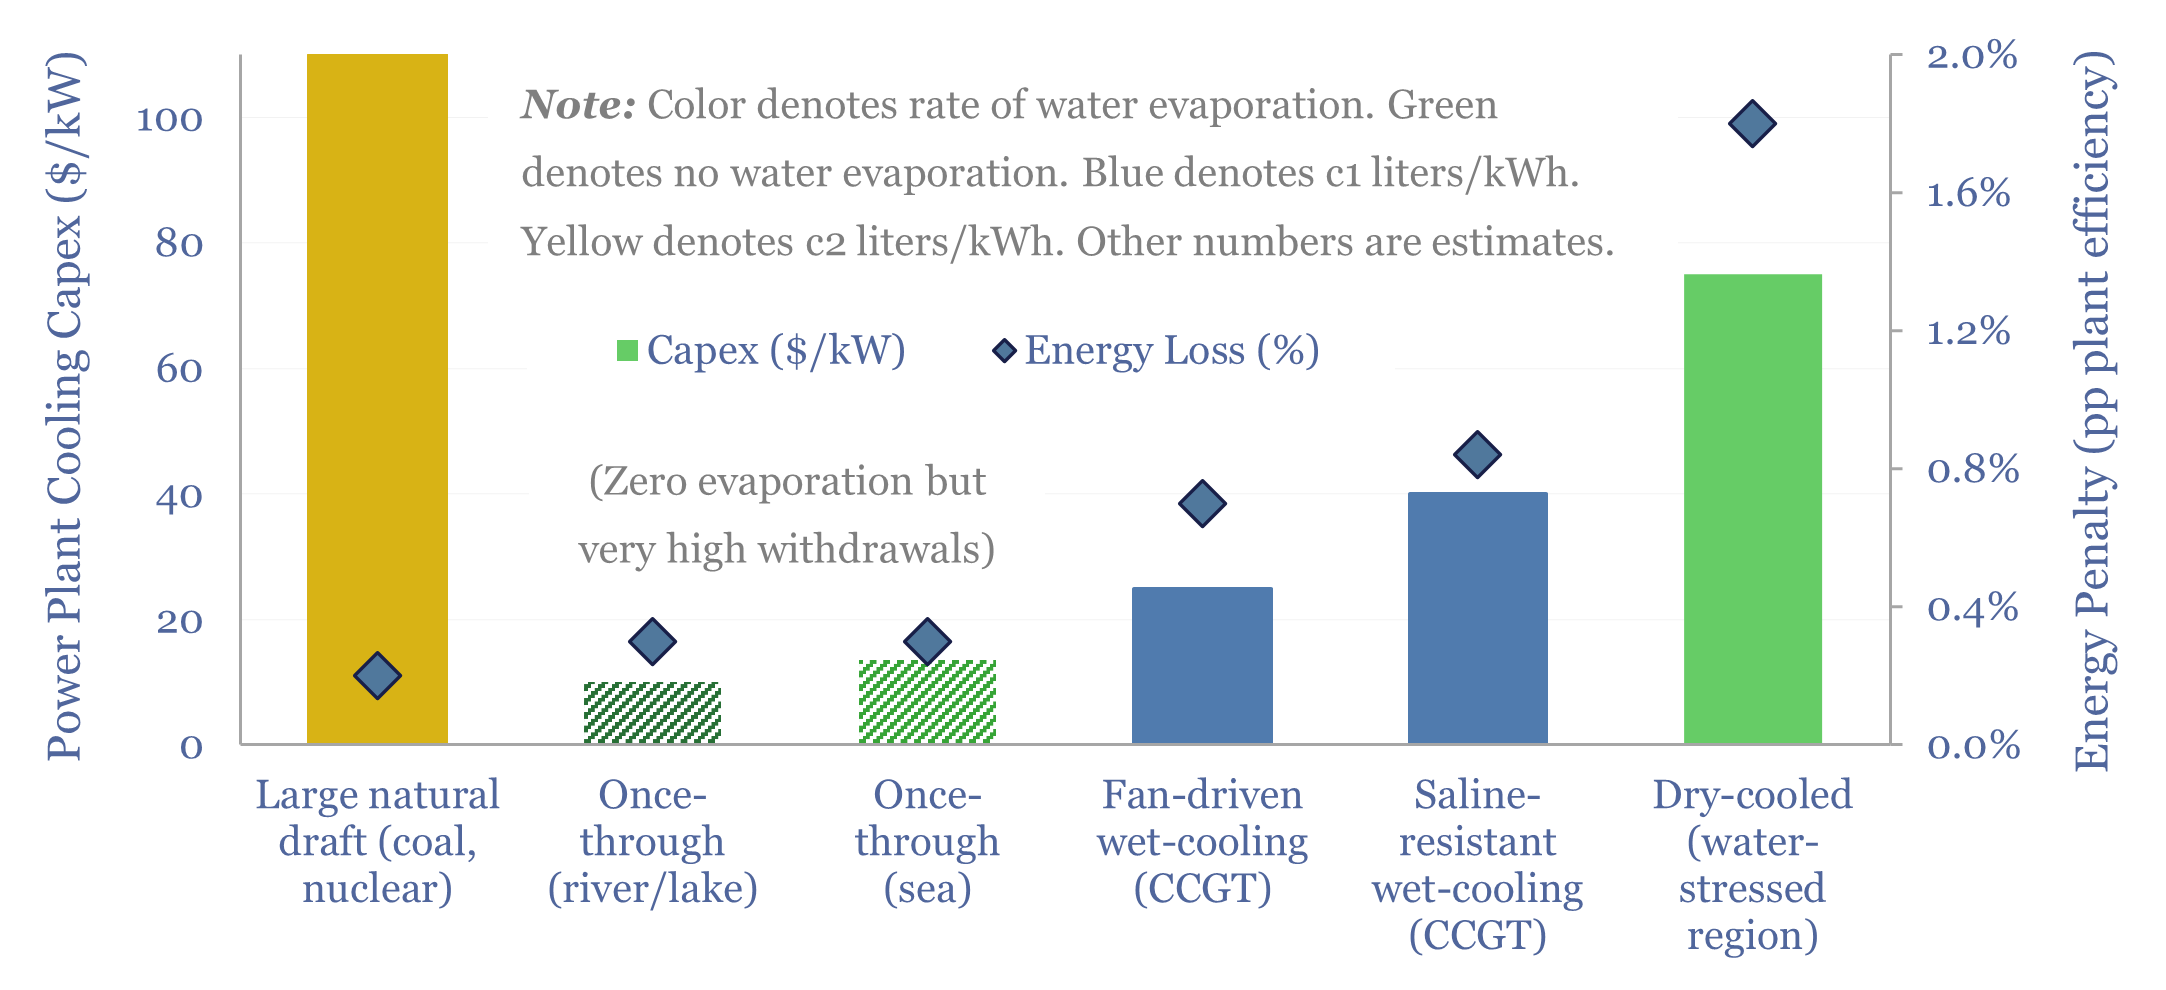
Water is needed to condense steam, downstream of the steam turbines, in nuclear, coal and CCGT power plants. But thermal power demands and fresh water scarcity are both structurally rising. Hence this 16-page report explores how the energy industry might adapt, trends in power plant cooling, and who benefits.
-
Global energy: supply-demand model?
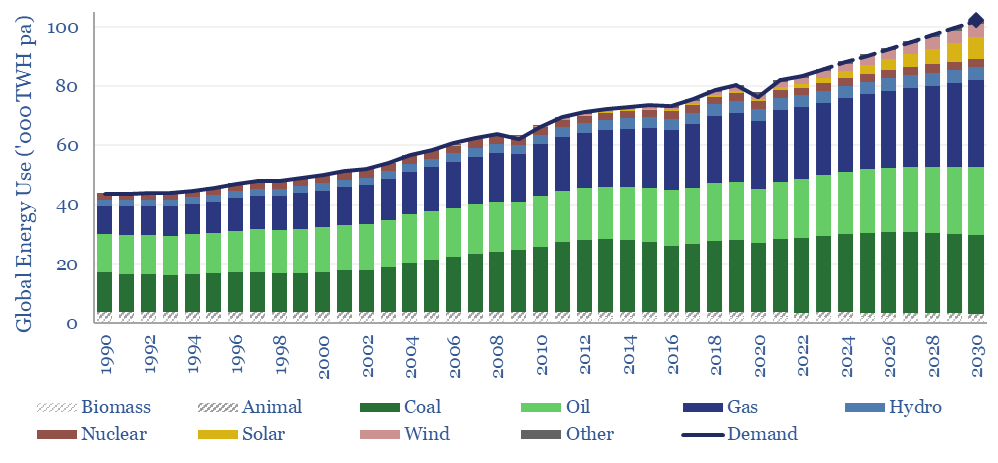
This global energy supply-demand model combines our supply outlooks for coal, oil, gas, LNG, wind and solar, nuclear and hydro, into a build-up of useful global energy balances in 2023-30. Energy markets can be well-supplied from 2025-30, barring and disruptions, but only because emerging industrial superpowers will continuing using high-carbon coal.
-
Where is oil industry R&D focused?
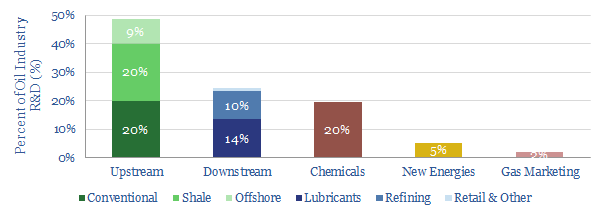
Shale comprises c5% of global supply and c20% of global R&D; while offshore comprises c30% of global supply, but <10% of global R&D, according to our estimates. This simple file aims to break down the oil and gas industry’s R&D activities, by category and sub-category, based on the >1,000 patents and >300 SPE papers we…
-
World’s largest energy assets: by category and risk?
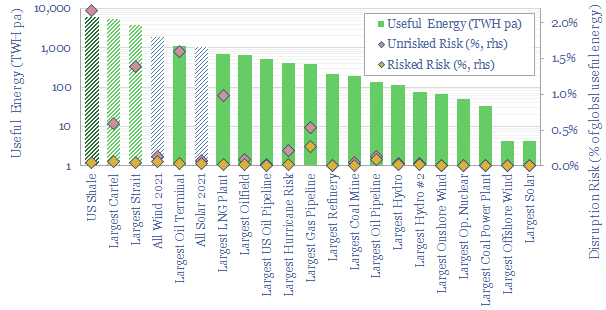
The largest hydrocarbon mega-projects are still 10-25x larger than the world’s largest solar and offshore wind projects. Risks are different in each category. But on a risked basis, global energy supplies may come in c2% lower than base case forecasts
-
Silica producers: screen of leading companies?
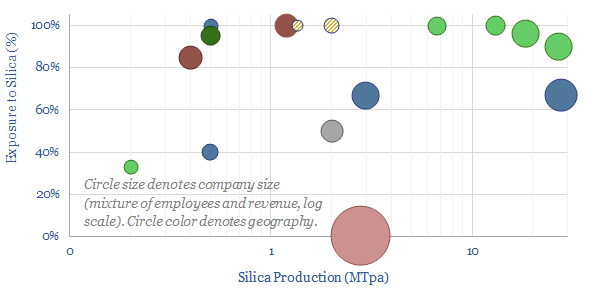
Highly pure silica sand, with well over 95% SiO2 content and less than 0.6% iron oxide, is an important resource used in making glass, metal foundries, “proppant” for hydraulic fracturing in the oil and gas industry and making high-grade silicon (for chips and PV silicon). The market is 350MTpa. This data-file is a screen of…
-
Global gas supply-demand in energy transition?
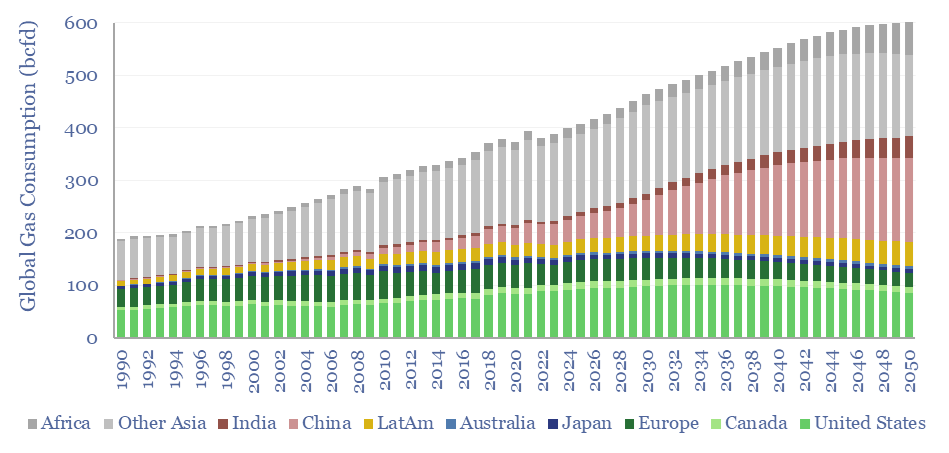
Global gas supply-demand is predicted to rise from 400bcfd in 2023 to 600bcfd by 2050, in our outlook, while achieving net zero would require ramping gas even further to 800bcfd, as a complement to wind, solar, nuclear and other low-carbon energy. This data-file quantifies global gas demand and supply by country.
-
Oil markets: the next up-cycle?
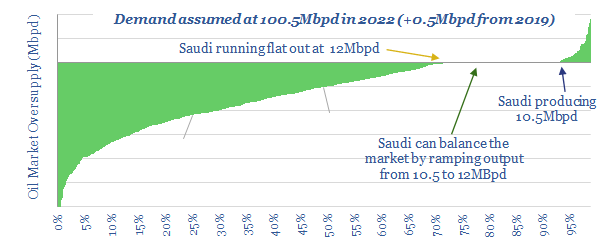
2022 oil markets now look 2Mbpd under-supplied, portending another industry up-cycle. Excess inventories from the COVID crisis have been drained by early-2021, allowing OPEC to ramp back. Yet a further 2.5bn bbls will drain by mid-2023. It takes until 2024 for oil markets to re-balance. Inventories remain historically low until late in the decade.
-
Flaring reduction: screen of service and equipment companies?
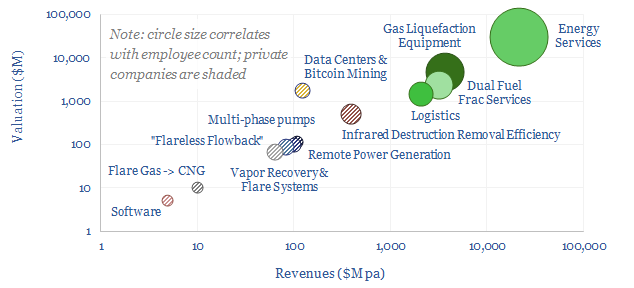
This data-file is a screen of companies that can reduce routine flaring and reduce the ESG impacts of unavoidable residual flaring. The landscape is broad, ranging from large, listed and diversified oil service companies with $30bn market cap to small private analytics companies with
-
Development capex: long-term spending from Oil Majors?
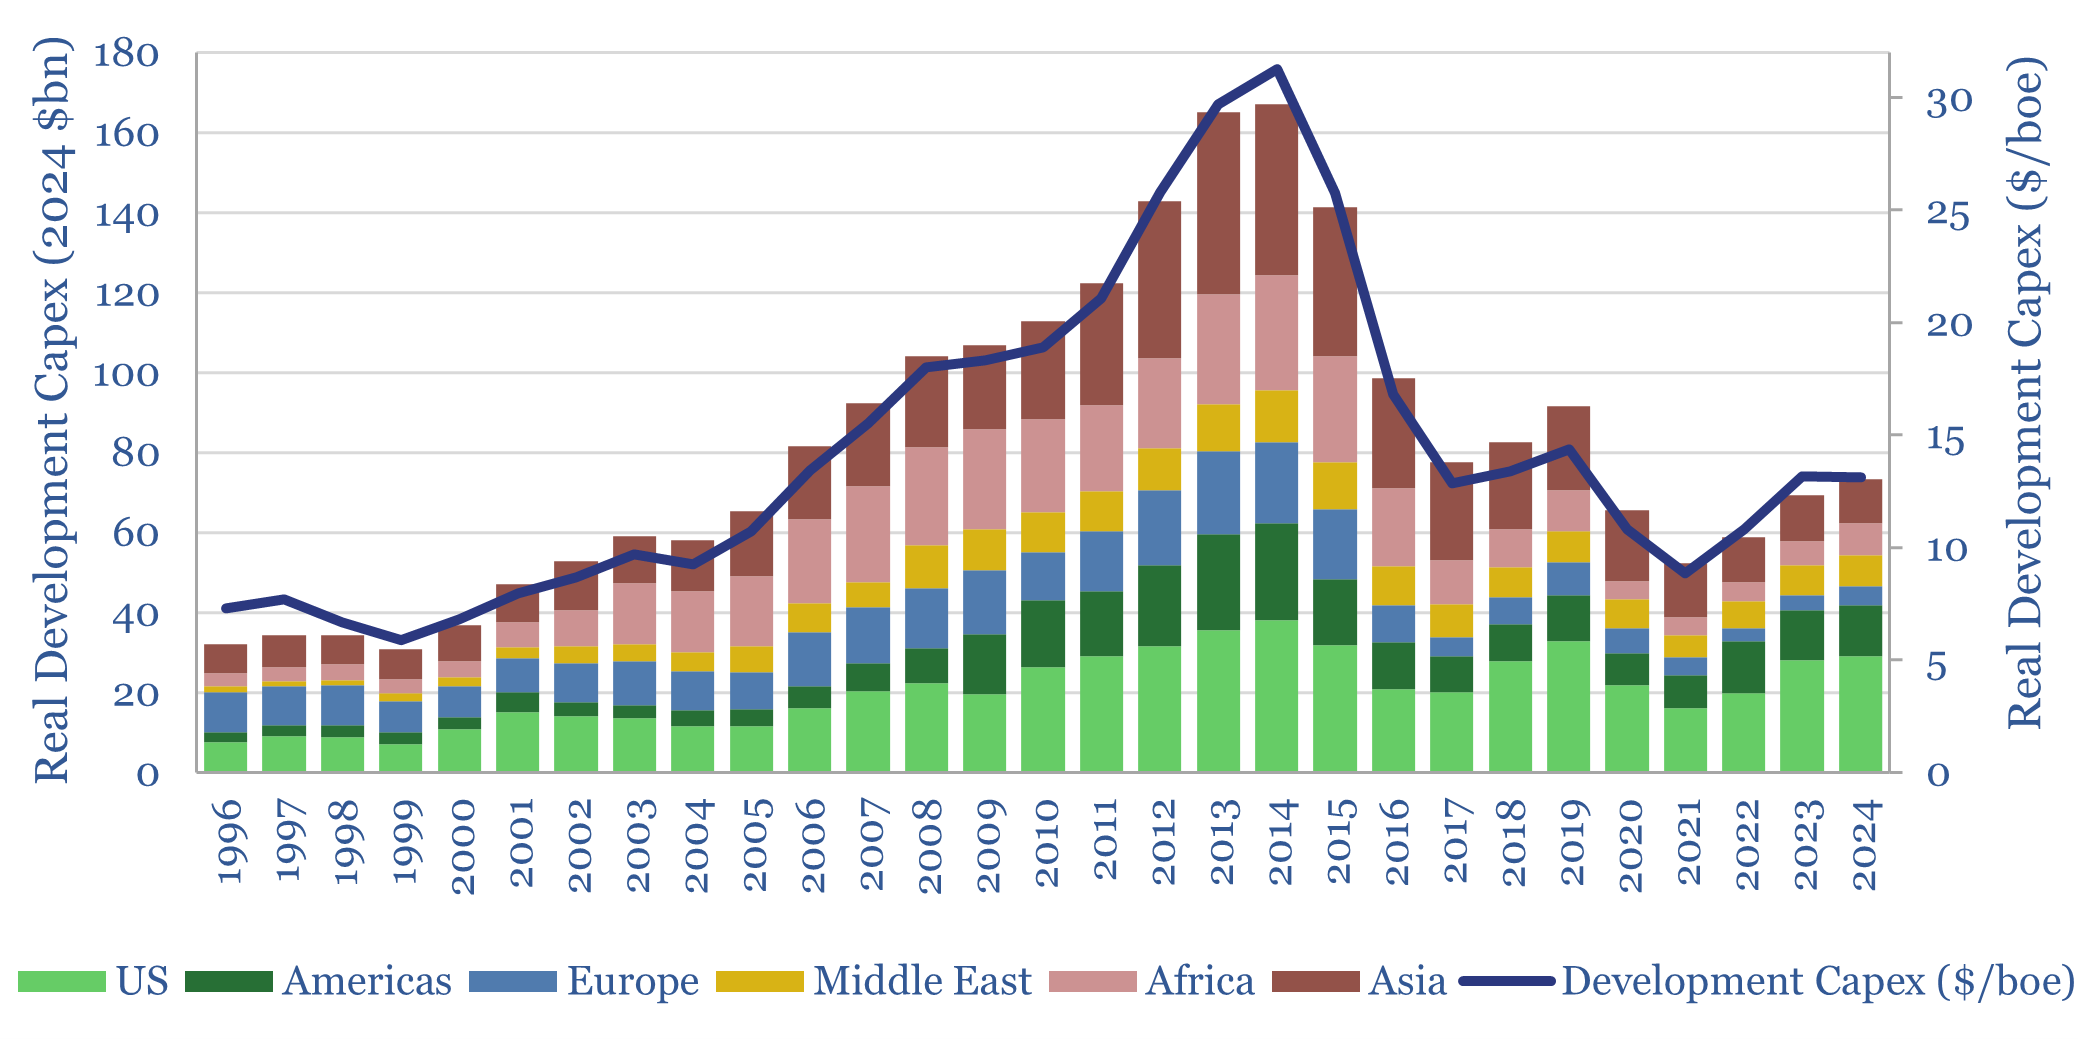
This data-file tabulates the five ‘Big Oil’ Super-Majors’ development capex from the mid-1990s, in headline terms (billions of dollars) and in per-barrel terms ($/boe of production). Real development capex quadrupled from $6/boe in 1995-2000 to $24/boe in 2010-15, collapsed to $10/boe, then recovered to $13/boe.
-
Hydraulic Fracturing: where’s the IP?
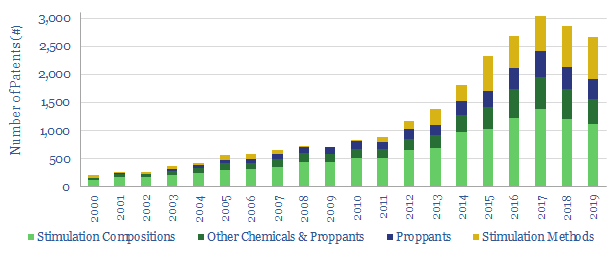
This data-file tracks 17,000 hydraulic fracturing patents filed by geography, by company, by year, since 2010. 2020 has slowed by 6% from peak, with a c36% US slowdown masked by a 33% Chinese expansion. Remarkably, in 2019, the leading Chinese Major filed more patents than the leading US Service provider. The full data-file ranks the companies.
Content by Category
- Batteries (89)
- Biofuels (44)
- Carbon Intensity (49)
- CCS (63)
- CO2 Removals (9)
- Coal (38)
- Company Diligence (95)
- Data Models (840)
- Decarbonization (160)
- Demand (110)
- Digital (60)
- Downstream (44)
- Economic Model (205)
- Energy Efficiency (75)
- Hydrogen (63)
- Industry Data (279)
- LNG (48)
- Materials (82)
- Metals (80)
- Midstream (43)
- Natural Gas (149)
- Nature (76)
- Nuclear (23)
- Oil (164)
- Patents (38)
- Plastics (44)
- Power Grids (131)
- Renewables (149)
- Screen (117)
- Semiconductors (32)
- Shale (51)
- Solar (68)
- Supply-Demand (45)
- Vehicles (90)
- Wind (44)
- Written Research (356)