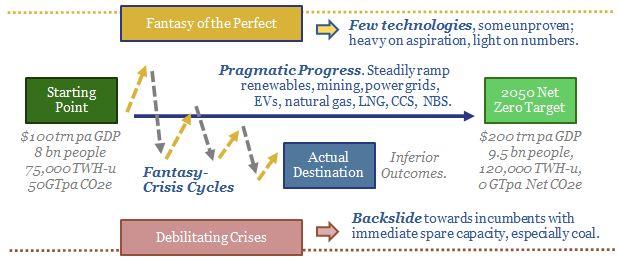
Energy transition: the fantasy of the perfect?

Energy transition fantasy crisis

This 14-page note explores an alternative framework for energy transition: what if the fantasy of perfect energy consistently de-rails good pragmatic progress; then the world back-slides to high-carbon energy amidst crises? We need to explore this scenario, as it yields very different outcomes, winners and losers compared with our roadmap to net zero.


Energy transition fantasy crisis. New energies are amazing. But their future ramp-up creates uncertainties that will naturally deter investment. If future technologies are going to be close to perfect – low-cost, clean, abundant, practical – then why invest in anything less than perfect? The paradox is that under-investment in energy amplifies the risks of crises. And during a crisis, priorities shift. The goal is simply to end the crisis. Quickly. Even if it means backsliding towards higher-carbon energy. This is what we call a ‘fantasy crisis cycle’. The logic of this framework is explained on pages 2-3.

Pragmatism unravelled? Real world projects and technologies are almost always less than perfect. Thus they will tend to get overlooked when perfection is the standard. And they take a long time to construct, which means that they cannot help resolve crises. Thus we think that energy transition fantasy crisis cycles are going to lead to lower deployment of most of the pragmatic investments needed in our roadmap to net zero. Seven main categories and examples are noted on pages 4-5.

How to avoid energy transition fantasies? The thing about perfection is that it is easy to imagine and difficult to deliver. We suggest some criteria to identify fantasy thinking, and risk future technologies appropriately, on pages 6-7.

Any port in a storm? If we do not invest enough in energy and materials, then we will have shortages of energy and materials, and the most likely result is a series of crises. Crises and their implications are discussed on pages 8-9.

Fantasy crisis cycles. Case studies are presented of prior fantasy crisis cycles in energy industry history, going back to the 1950s, and running through to the present day, on pages 10-11.

Winners and losers? Nobody fares well in a crisis, in absolute terms. But some industries fare materially better in relative terms, especially relative to expectations during the fantasy phase, and relative to our usual roadmap to net zero. The outlook for large companies, large incumbents, especially coal producers, gets discussed on pages 12-14.

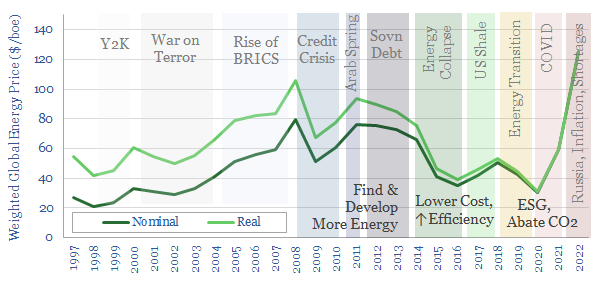
Energy transition: wheel of time?

Energy transition mega-trends

This 15-page note reflects on the last 15-years of energy, the world and our own experiences. Energy transition mega-trends do not move in straight lines. The world has often changed direction, getting waylaid by unexpected crises. Thus we wonder if energy transition goals, policies, and solutions may shift?


This note is based on anecdotal experiences, looking back at events remembered across 15-years covering the energy industry, and beyond. If you had lived through these experiences (and honestly, some of these over-extrapolations), how would this re-shape your view of the world’s transition towards net zero?

The world’s transition to net zero is described on pages 2-3, and we think this has become something of a consensus view, meant to play out following “straight line” extrapolations, which have note served us well in our analytical career.

Our experiences of world events are re-capped on pages 4-6, noting frequent ‘shocks’ and ‘crises’, changing the direction of big trends in human history, often unpredictably.

Our experiences in energy markets are re-capped on pages 7-11. The main focus transformed from ‘finding and developing more energy’ (2011-14) to ‘cutting costs and raising efficiency’ (2015-18) to ‘ESG and decarbonization’ (2019-22).

Five conclusions are drawn from these anecdotes on pages 12-14. Doom-mongering has tended to be wrong. The real crises have been the ones that no-one predicted. Straight-line extrapolations have been painfully wrong. Mega-trends exist, but their progress waxes and wanes over time.

Conclusions. We wonder whether the energy transition mega-trends could see a few years of waning progress in the mid-2020s, despite its long-run importance. Low-cost, pragmatic and resilient solutions may fare best in this timeframe.

To learn more about our thoughts and insights on energy transition and how we evaluate some of the short- and medium-term options to alleviate energy shortages, please see our article here.

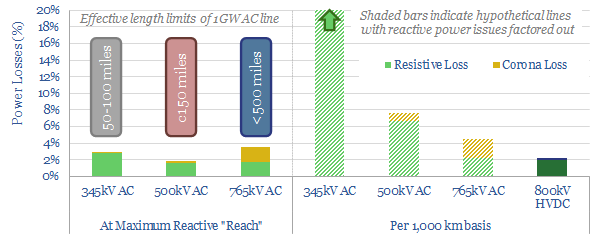
Power transmission: raising electrical potential?

HVDCs in energy transition

Electricity transmission matters in the energy transition, integrating dispersed renewables over long distances to reach growing demand centers. This 15-page note argues future transmission needs will favor large HVDCs in energy transition, costing 2-3c/kWh per 1,000km, which are materially lower-cost and more efficient than other alternatives. What opportunities follow?


Long distance power transmission is likely to grow more important in the energy transition. There are six reasons for this claim, especially linked to wind and solar, which are laid out on pages 2-4.

The simple physics of power transmission are laid out on pages 5-7, with worked examples showing how the existing grid transmits relatively small power quantities over relatively low distances, but resistive power losses ‘blow up’ if we try to expand AC power lines.

Overcoming these challenges via higher voltages and thicker power cables is not really feasible, especially as reactive power consumption becomes the limiting factor on AC lines. Again, the techno-economic theory behind these claims is laid out on pages 8-11.

HVDC lines melt away many of the problems noted above. We outline the reasons on page 12, along with real-world data from world-leading HVDC projects that have been constructed in China since 2010.

Economics. We think HVDCs can deliver multi-GW power, over distances around 3,000km, for total transmission spreads of 5-10c/kWh. Underlying assumptions, and comparisons with other technologies — batteries, hydrogen — are given on page 13.

Who benefits? Some of the leading companies in HVDC, and interesting new project proposals are discussed on page 14.

To read more on HVDCs in energy transition and its leading companies, please see our article here.

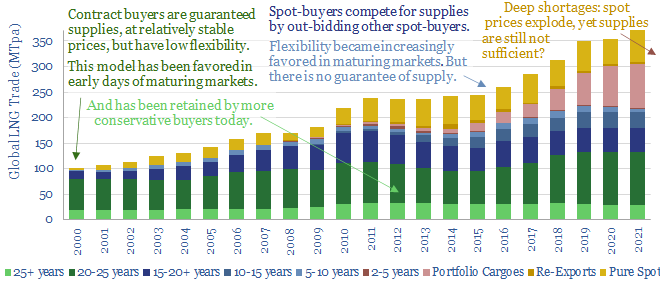
Energy security: the return of long-term contracts?

Energy commodities

Spot markets have delivered more and more ‘commodities on demand’ over the past half-century. But is this model fit for the energy transition? Many markets are now desperately short, causing explosive price rises. And sufficient volumes may still not be available at any price. So this 13-page note on energy commodities considers a renaissance for long-term contracts and who might benefit?


Liquid spot markets have long been seen as the apotheosis of commodities. Over time, small and immature markets are supposed to graduate towards ever-greater liquidity. Ultimately, the entire market is to be bought and sold at the prevailing prices on some highly liquid exchange, where any seller in the market can reach any buyer in the market, and vice versa. It is a kind of “commodities on demand” model. The history and evolution of this model is laid out on pages 2-3. But 2022 is showing its limitations.

Challenge #1 for liquid spot markets is that prices can explode in a shortage. We review energy costs, price elasticity factors, and their consequences on pages 4-6.

Challenge #2 for liquid spot markets is that even after prices explode, sufficient supplies may still not be available at any price. We zoom in on LNG as an example on pages 7-8. A country that has 90% of its supplies locked in on contracts is clearly going to fare very differently in 2022-23 than one that had planned to source 90% of its supplies from the spot market.

Challenge #3 is securing future supplies amidst uncertainty. No one wants to finance a 20-year project where prices could collapse, volumes could collapse or the commodity in question could even be banned outright. As an OPEC oil minister recently stated “it isn’t going to work like that”.

Could all of this point to a renaissance for long-term contracts? On pages 11-13, we outline what this might look like, who might benefit, and some possible pushbacks.

For an outlook on our top 10 energy commodities with upside in the energy transition, please see our article here.

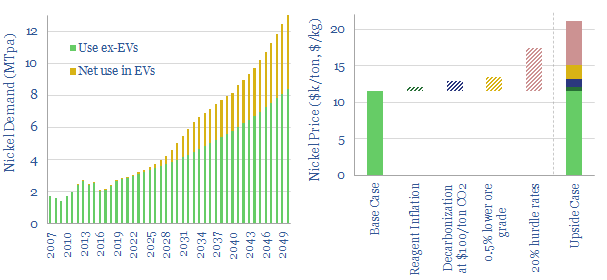
Nickel solutions: unblocking a battery bottleneck?

Nickel upside energy transition

The global nickel market will grow from $30bn pa to $300bn pa as part of the energy transition, including a 5x increase in volumes and 2x increase in prices. This 15-page note evaluates the nickel supply chain for electric vehicle battery cathodes. Deficits are looming, plus inflationary feedback loops, hence we end by screening nickel names.


An overview of global nickel demand is set out on pages 2-4. We see stainless demand growing with GDP and EV battery demand rising c30x through 2050.

An overview of global nickel supply is set out on pages 5-9. This is a complex supply chain. Only a subset of processes and nickel grades can satiate demand for EV cathodes. We focus in on a laterite – HPAL – MHP – nickel sulphate pathway in this work.

Nickels and dimes. Economics of producing battery grade nickel (in $/ton) are captured on page 10, as a function of a dozen input variables, which can be stress-tested. Our marginal cost estimate is around $11,500/ton with a CO2 intensity of 15 tons/ton.

Nickel bars. There are three bottlenecks to ramping up battery grade nickel production, outlined on pages 11-12. We argue these may settle long-term future prices closer to $20,000/ton.

Upside for nickel in the energy transition is compared with other materials that have crossed our screens on page 13. It is one of the toppier examples.

A screen of nickel companies is presented on page 14-15, covering incumbents, diversified miners, specialists and growth projects.

To find out which companies dominate the world’s nickel production, please see our article here.

Energy transition: the world turned upside down?

Alleviate energy shortages

This 14-page note evaluates short- and medium-term options to alleviate energy shortages, which are now the second largest problem in the world. Despite a lot of posturing, we see ‘new energies’ slowing down in 2022-23. The world is upside down and somehow coal is going to be an unexpected savior.


What happens in an energy shortage? In 2022, energy will absorb the largest share of GDP and consumer expenditures on record. We present the data on pages 2-3 and the challenges thereby created.

Curtailing demand is the only short-term option to alleviate energy shortages. There are three possible mechanisms of demand destruction, described on pages 4-5. There are no good options here, only ‘less bad’ ones.

Increasing energy supplies will be determined by what can actually increase. The largest option is coal, then short-cycle shale, as quantified on pages 6-8.

Doubling down on new energies may paradoxically exacerbate the energy shortages, as many of these technologies have ‘energy paybacks’ over 1-2 years (chart above). We want to do these things in the long-run. But they become harder in the short-run (pages 9-12).

Seven predictions are offered for decision-makers on pages 13-14. These are our best ideas for positioning in the current environment and also putting ‘energy transition’ back on track.

To read more about the options to alleviate energy shortages, please see our article here.

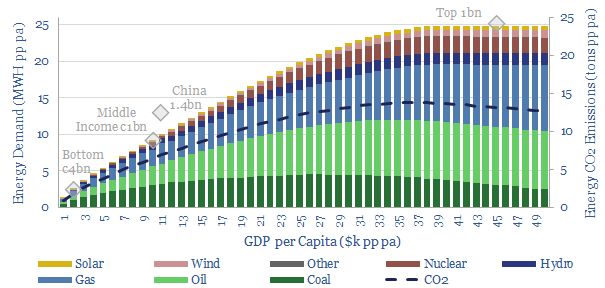
Energy shortages: priced out of the world?

Energy shortages in low income countries

Deepening energy shortages in 2022-30 could devastate low-income countries, geopolitically isolate the West, and de-rail decarbonization. This 13-page note evaluates the linkage between energy consumption and income over the past half century and quantifies what a ‘just transition’ would look like.


The reason for this research note on is that we see energy shortages deepening throughout the 2020s. This suggests someone will need to curtail energy use. What is the answer is low-income consumers in low-income countries? (pages 2-3).

Key trends from 50-years of global economic development are drawn out on pages 4-6, after tabulating 60,000 data-points, across 25 key countries and regions. The depressing conclusion is around 10x ‘energy inequality’ between the top 1bn and the bottom 4bn.

Our analysis on energy shortages in low income countries most likely under-states the degree of energy use inequality, for methodological reasons, discussed on page 7.

What is a ‘just transition’? Our answer is laid out on pages 8-9, finding a balance between economic development and energy usage.

Constructive options. The biggest bottleneck for a just ‘energy transition’, clearly, definitively, is a lack of energy investment, especially renewables and natural gas. Shortly followed by greater efficiency initiatives in the West (pages 10-11).

Our conclusions and questions over the future of world economic development amidst the energy transition are laid out on pages 12-13.

To read about some of our ideas on how to cure emerging energy shortages in the gas and power sectors, please see our article here.

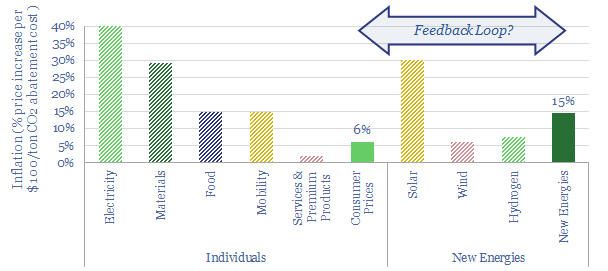
Inflation: will it de-rail the energy transition?

Inflation from energy transition policies

New energy policies will exacerbate inflation in the developed world, raising price levels by 20-30%. Or more, due to feedback loops. We find this inflation could also cause new energies costs to rise over time, not fall. As inflation concerns accelerate, policymakers may need to choose between delaying decarbonization or lower-cost transition pathways.


The importance of costs on the roadmap to net zero evokes a surprising amount of debate. We re-cap these debates, including our own roadmap on pages 2-3. Recently, organizations such as the IEA have published a roadmap, which we believe will be c10x more expensive.

The inflationary impacts of energy transition can be compared for different levels of abatement costs. Hence we discuss the concept of abatement costs, including two paradoxes, on pages 4-5.

Top-down, we calculate that each $100/ton of CO2 abatement cost would likely lead to 6% aggregate price increases in the developed world, on page 6.

Bottom-up, we model that each $100/ton of CO2 abatement cost would lead to 2-70% price increases, across a basket of twenty different goods and commodities, on pages 7-8. The impacts are regressive and basic goods and staples rise more.

An additional source of inflation comes from supply-demand dynamics, as some materials will be dramatically under-supplied in the energy transition (page 9).

What does it mean for new energies? To answer this question, we bridge the impacts of all these cost increases in our models of wind, solar, hydrogen and batteries, on pages 10-12. There are surprising feedback loops, which could amplify inflation.

No brakes? We also find that the usual mechanism to slow inflation is blunted by the need for an energy transition, on pages 13-14. Hence if inflation accelerates, it could surprise by a wide margin.

Our conclusion is that policy-makers and companies should consider costs more closely, while there are measures for investors to inflation-proof portfolios.

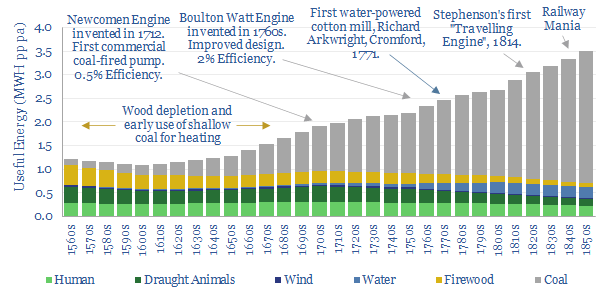
Britain’s industrial revolution: what happened to energy demand?

britain's industrial revolution

Britain’s remarkable industrialization in the 18th and 19th centuries was part of the world’s first great energy transition. In this short note, we have aggregated data, estimated the end uses of different energy sources in the Industrial Revolution, and drawn five key conclusions for the current Energy Transition.


In this short note, we have sourced and interpolated long run data into energy supplies in England and Wales, by decade, from 1560-1860. The graph is a hockey stick, with Britain’s total energy supplies ramping up 30x from 18TWH to 515TWH per year. Part of this can be attributed to England’s population rising 6x, from around 3M people to 18M people over the same timeframe. The remainder of the chart is dominated by a vast increase in coal from the 1750s onwards.

britain's industrial revolution

A more comparable way to present the data is shown below (and tabulated here). We have divided through by population to present the data on a per-capita basis. But we have also adjusted each decade’s data by estimated efficiency factors, to yield a measure of the total useful energy consumed per person. For example, coal supplies rose 40x from 1660 to 1860, but per-capita end use of coal energy only rose c6.5x, because the prime movers of the early industrial revolution were inefficient. This note presents our top five conclusions from evaluating the data.

britain's industrial revolution

Five Conclusions into Energy Demand from the Industrial Revolution

(1) Context. Useful energy demand per capita trebled from 1MWH pp pa in the 1600s to over 3MWH pp pa in the mid-19th century, an unprecedented increase.

For comparison, today’s useful energy consumption per capita in the developed world is 6x higher again, as compared with the 1850s. A key challenge for energy transition in the developed world is that people want to keep consuming 20MWH pp pa of energy, rather than reverting to pre-industrial or early-industrial energy levels. As a rough indicator, 20MWH is the annual energy output of c$120-150k of solar panels spread across 600 m2 (model here).

Furthermore, today’s useful energy consumption in the emerging world is only c2x higher than Britain in the 1860s. I.e., large parts of the emerging world are in very early stages of industrialization, comparable to where Britain was 150-years ago. Models of global decarbonization must therefore allow energy access to continue rising in the emerging world (charts below), and woe-betide any attempt to stop this train.

britain's industrial revolution

(2) Shortages as a driver of transition? One of the great cliches among energy analysts is that we “didn’t emerge from the stone age because we ran out of stone”. In Britain’s case, in fact, the data suggest we did shift from wood to coal combustion as we began to run out of wood.

Wood use and total energy use both declined in the 16th Century, and coal first began ramping up as an alternative heating fuel (charts above). In 1560, Britain’s heating fuel was 70% wood and 30% coal. By 1660, it was 70% coal and 30% wood. This was long before the first coal-fired pumps, machines or locomotives.

This is another reminder that energy transitions tend to occur when incumbent energy sources are under-supplied and highly priced, per our research below. Peak supply tends to preceed peak demand, not the other way around.

(3) Energy transition and abolitionism? Amazingly, human labor was the joint-largest source of useful energy around 1600, at c25% of total final energy consumption. But reliance upon human muscle power as a prime mover was bound up in one of the greatest atrocities of human history: the coercion of millions of Africans, slaves and serfs; to row in galleys, transport bulk materials and work land.

By the time Britain banned the slave trade in 1807, human muscle power was supplying just 10% of usable energy. By the time of the Abolition Act in 1833, it was closer to 5%.

Some people today feel that unmitigated CO2 emissions is an equally great modern-day evil. On this model, it could be the vast ramp-up of renewable energy that eventually helps to phase out conventional energy. But our current models below do not suggest that renewables can reach sufficient size or scale for this feat until around 2100.

What is also different today is that policy-makers seem intent on banning incumbent energy sources before we have transitioned to alternatives. We have never found a good precedent for bans working in past energy systems. Although US Prohibition, from 1920-1933, makes an interesting case study.

britain's industrial revolution

(4) Jevons Paradox states that more efficient energy technologies cause demand to rise (not fall) as better ways of consuming energy simply lead to more consumption.

Hence no major energy source in history has ‘peaked’ in absolute terms. Even biomass and animal traction remain higher in absolute terms than before the industrial revolution, both globally and in our UK data from 1560-1860.

Jevons Paradox is epitomized by the continued emergence of new coal-consuming technologies in the chart below, which in turn stoked the ascent of coal-powered demand, while wood demand was not totally displaced.

The fascinating modern-day equivalent would suggest that the increasing supply of renewable electricity technologies will create new demand for electric vehicles, drones, flying cars, smart energy and digitization; rather than simply substituting out fossil fuels.

britain's industrial revolution

(5) Long timeframes. Any analysis of long-term energy markets inevitably concludes that transitions take decades, even centuries. This is visible in the 300-year evolution plotted above, and in the full data-set linked below. Attempts to speed up the transition create the paradox of very high costs or potential bubbles. We have also compiled a helpful guide into transition timings by mapping twenty prior technology transitions. Our recent research, summarized below, covers all of these topics, for further information.


Source: Wrigley, E. A. (2011). Energy and the English Industrial Revolution, Cambridge, TSE Estimates. With thanks to the Renewable Energy Foundation for sharing the data-set.

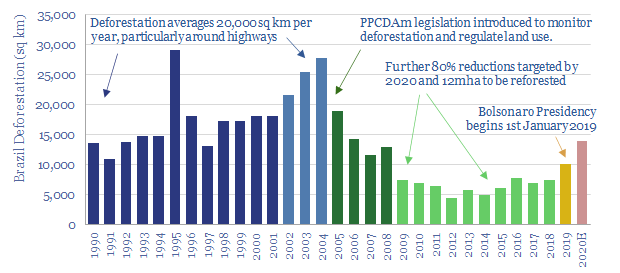
The Amazon tipping point theory?

The Amazon tipping point theory

The Amazon tipping point theory postulates that another 2-10% deforestation could make the world’s largest tropical rainforest too dry to sustain itself. Thus the Amazon would turn into a savanna, releasing 80GT of carbon into the atmosphere, single-handedly inflating atmospheric CO2 by 40ppm (to well above the 450ppm limit for 2C warming). This matters as Amazon deforestation rates have already doubled under Jair Bolsonaro’s presidency. This note explores implications, including international tensions, divestments, prioritization in a Biden presidency, and consequences for other transition technologies.


Global deforestation remains the single largest contributor to CO2e-emissions induced by man’s activities, more than the emissions from all passenger cars; and destruction of nature remains the largest overall contributor, more than all of China (chart below). This note is about a particularly worrying feedback loop in the Amazon rainforest, which could single-handedly wipe out the world’s remaining CO2 budget, effectively negating the impact of all other climate policies globally.

What is the Amazon tipping point theory?

The Amazon rainforest currently covers 5.5M square kilometers, comprising the largest, contiguous tropical forest in the world. 50% is in Brazil, and the remainder is spread around Peru, Colombia and half-a-dozen other South American countries. It contains 20% of all the planet’s plant and animal species, including 40,000 plant species alone.

Deforestation of the Amazon has reached 15-17% of its original area overall, and around 19% in Brazil. 800,000 square kilometers has been lost to-date (a land area equivalent to 2x California; or all of France plus Germany). Brazil’s annual deforestation rates have averaged 20,000 square kilometers per year from 1990-2004 (the land area of New Jersey or Slovenia). But the rate slowed to a trough of 5,000 square kilometers in 2014 due to improving environmental policies.

Unfortunately, more recently, Brazil’s deforestation rate has re-doubled (chart below). Jair Bolsonaro’s Presidency began in January-2019, following campaign pledges to ease environmental and land use regulations (which require 80% of legal Amazon land holdings to remain uncleared). Violations of these regulations are now said to be going unpunished. Bans on planting sugarcane in the Amazon have been lifted. Bolsonaro has even repudiated data published by Brazil’s own government agencies showing deforestation rates rising and accused actor and environmentalist, Leonardo DiCaprio of starting wildfires!

This matters because of the hydrology of the Amazon. Water in the basin tends to move from East to West. Each molecule typically falls as rainfall six times. It is repeatedly taken up by trees, transpired back into the atmosphere, and precipitated back down to Earth. Over half of the rain falling in the Amazon has originated from trees in the Amazon. It is a self-sustaining feedback loop.

The Amazon Tipping Point theory predicts that below some critical level of forest cover, this self-sustaining feedback loop will break. Less rainforest means less transpiration. Less transpiration means less rainfall. Less rainfall means less rainforest. Specifically, converting each hectare of forest to cropland reduces regional precipitation by 0.5M liters/year.

After the tipping point it is feared that the basin will transition into a savanna or scrubland. 50-100% of the forest cover would die back.

Unfortunately, this is not a ‘fringe’ theory. Many different technical papers acknowledge and model the risk, although specific climate models are imprecise, and do not always agree on timings and magnitudes. For example, the Western Amazon, closer to the Andes, might retain more forests than the East and Central parts of the basin. Another uncertainty is the moderating impacts of fire, as dryer forests will be more flammable, and thus more susceptible to slash-and-burn clearances, while raging fires will also reach further.

When is the tipping point? Various technical papers have estimated that the Amazon tipping point occurs when 20-25% of the forest has been cleared. This is an additional 2-10% from today’s levels, equivalent to deforesting another 100-600k acres, which could happen within 2-30 years.

What carbon stock is at risk of being released?

A typical forest contains around 300T of carbon per hectare (chart below). Thus 5.5M square kilometers of the Amazon is expected to contain 165GT of carbon. About 40% of the carbon is usually stored in trees (estimated at 60-80GT in the Amazon) and 60% is stored in roots and soils, which degrades more slowly. Hence, if just half of the remaining Amazon disappears, this would slowly release c80GT of carbon into the atmosphere.

Each billion tons (GT) of carbon released into the atmosphere is equivalent to raising atmospheric CO2 by around 0.5ppm. Hence a 80GT carbon release from the Amazon would by itself raise atmospheric CO2 from 415ppm today to around 455ppm. This single change (notwithstanding the continued and unmitigated burning of fossil fuels) would tip the world above the 450ppm threshold needed to keep global warming to an estimated 2-degrees (climate model below).

Can the tipping point be averted?

The solution to Amazon tipping points is technically simple: stop burning down forests and start re-planting them. This does not require electrolysing water molecules into hydrogen, smoothing volatility in renewable-heavy grids, or developing next-generation batteries. It requires something much harder: international diplomacy.

Inflammatory statements? In September-2019, Bolsonaro defended his environmental policies in a speech at the UN General Assembly. International critics were accused of assaulting Brazil’s sovereignty. Brazil considers itself free to prioritize economic development over environment.

Forest for ransom? In the past, Western countries have actually paid Brazil to safeguard its rainforests, although this arrangement has now fallen apart. Specifically, the ‘Amazon Fund’ was created in 2008. It is managed by Brazil’s state-owned development bank, BNDES. $1.3bn has been donated to the fund, from Norway (94%), Germany (5%) and Petrobras (1%). But after taking office, Bolsonaro has packed the fund’s steering committee with members of his inner circle, and in May-2019, he started using the Fund to compensate land developers whose lands were confiscated for environmental violations. Hence Norway and Germany suspended fund payments.

Divestment and trade tensions? As Brazil’s stance on the Amazon has grown more confrontational, it is possible that decision-makers may distance themselves from the country. Global investment funds have threatened to divest. (Could Brazil even surpass the coal industry as the divestment movement’s whipping boy?). Multi-national corporations may also be more cautious around investing in the country (but probably at the margin). Finally, Amazon deforestation is said to endanger future trade deals.

The Biden Factor? President-elect Biden may also seek to influence the Amazon issue. Biden stated the world should collectively offer Brazil $20bn to stop Amazon deforestation and threaten economic consequences for refusing. An executive order re-entering the Paris Climate Agreement would also help the situation (Brazil had actually committed to restoring 12M hectares of native vegetation under the accord). It will be interesting to see how Biden balances climate-focused priorities in the US with this arguably more urgent issue abroad.

Crucial Conclusions? If the Amazon surpasses its tipping point, there would be no chance of limiting atmospheric CO2 to 450ppm or preventing a catastrophic loss of biodiversity. Diplomacy is difficult. But fortunately, decision-makers can take measures into their own hands. Our note below profiles tree-planting charities. This is the lowest-cost decarbonization option we have found in all of our research. It restores nature, including the Amazon. Ultimately, we have argued that restoring nature may the most practical route to achieving climate objectives, while ‘bursting the bubble’ of other transition technologies.

Copyright: Thunder Said Energy, 2019-2024.