Britain’s remarkable industrialization in the 18th and 19th centuries was part of the world’s first great energy transition. In this short note, we have aggregated data, estimated the end uses of different energy sources in the Industrial Revolution, and drawn five key conclusions for the current Energy Transition.
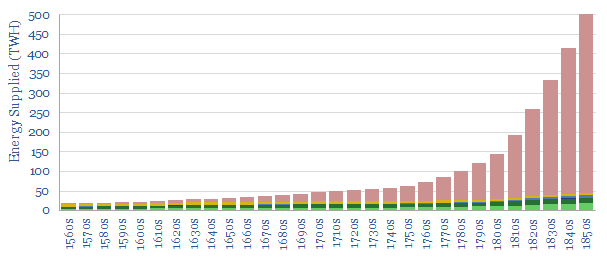
In this short note, we have sourced and interpolated long run data into energy supplies in England and Wales, by decade, from 1560-1860. The graph is a hockey stick, with Britain’s total energy supplies ramping up 30x from 18TWH to 515TWH per year. Part of this can be attributed to England’s population rising 6x, from around 3M people to 18M people over the same timeframe. The remainder of the chart is dominated by a vast increase in coal from the 1750s onwards.
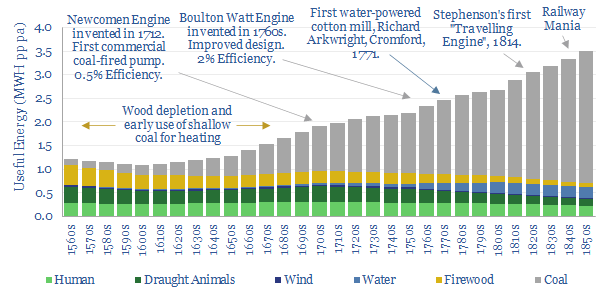
A more comparable way to present the data is shown below (and tabulated here). We have divided through by population to present the data on a per-capita basis. But we have also adjusted each decade’s data by estimated efficiency factors, to yield a measure of the total useful energy consumed per person. For example, coal supplies rose 40x from 1660 to 1860, but per-capita end use of coal energy only rose c6.5x, because the prime movers of the early industrial revolution were inefficient. This note presents our top five conclusions from evaluating the data.
Five Conclusions into Energy Demand from the Industrial Revolution
(1) Context. Useful energy demand per capita trebled from 1MWH pp pa in the 1600s to over 3MWH pp pa in the mid-19th century, an unprecedented increase.
For comparison, today’s useful energy consumption per capita in the developed world is 6x higher again, as compared with the 1850s. A key challenge for energy transition in the developed world is that people want to keep consuming 20MWH pp pa of energy, rather than reverting to pre-industrial or early-industrial energy levels. As a rough indicator, 20MWH is the annual energy output of c$120-150k of solar panels spread across 600 m2 (model here).
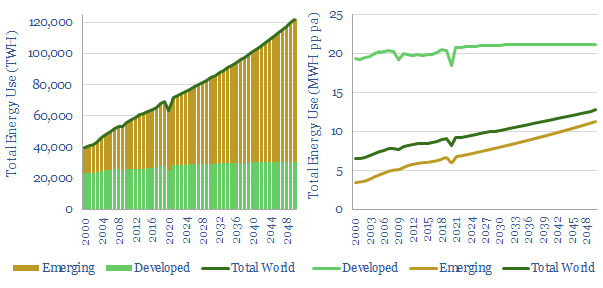
Furthermore, today’s useful energy consumption in the emerging world is only c2x higher than Britain in the 1860s. I.e., large parts of the emerging world are in very early stages of industrialization, comparable to where Britain was 150-years ago. Models of global decarbonization must therefore allow energy access to continue rising in the emerging world (charts below), and woe-betide any attempt to stop this train.
(2) Shortages as a driver of transition? One of the great cliches among energy analysts is that we “didn’t emerge from the stone age because we ran out of stone”. In Britain’s case, in fact, the data suggest we did shift from wood to coal combustion as we began to run out of wood.
Wood use and total energy use both declined in the 16th Century, and coal first began ramping up as an alternative heating fuel (charts above). In 1560, Britain’s heating fuel was 70% wood and 30% coal. By 1660, it was 70% coal and 30% wood. This was long before the first coal-fired pumps, machines or locomotives.
This is another reminder that energy transitions tend to occur when incumbent energy sources are under-supplied and highly priced, per our research below. Peak supply tends to preceed peak demand, not the other way around.
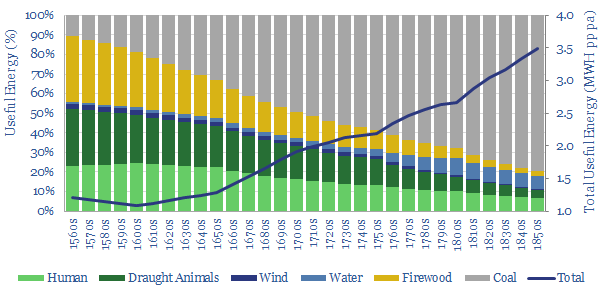
(3) Energy transition and abolitionism? Amazingly, human labor was the joint-largest source of useful energy around 1600, at c25% of total final energy consumption. But reliance upon human muscle power as a prime mover was bound up in one of the greatest atrocities of human history: the coercion of millions of Africans, slaves and serfs; to row in galleys, transport bulk materials and work land.
By the time Britain banned the slave trade in 1807, human muscle power was supplying just 10% of usable energy. By the time of the Abolition Act in 1833, it was closer to 5%.
Some people today feel that unmitigated CO2 emissions is an equally great modern-day evil. On this model, it could be the vast ramp-up of renewable energy that eventually helps to phase out conventional energy. But our current models below do not suggest that renewables can reach sufficient size or scale for this feat until around 2100.
What is also different today is that policy-makers seem intent on banning incumbent energy sources before we have transitioned to alternatives. We have never found a good precedent for bans working in past energy systems. Although US Prohibition, from 1920-1933, makes an interesting case study.
(4) Jevons Paradox states that more efficient energy technologies cause demand to rise (not fall) as better ways of consuming energy simply lead to more consumption.
Hence no major energy source in history has ‘peaked’ in absolute terms. Even biomass and animal traction remain higher in absolute terms than before the industrial revolution, both globally and in our UK data from 1560-1860.
Jevons Paradox is epitomized by the continued emergence of new coal-consuming technologies in the chart below, which in turn stoked the ascent of coal-powered demand, while wood demand was not totally displaced.
The fascinating modern-day equivalent would suggest that the increasing supply of renewable electricity technologies will create new demand for electric vehicles, drones, flying cars, smart energy and digitization; rather than simply substituting out fossil fuels.
(5) Long timeframes. Any analysis of long-term energy markets inevitably concludes that transitions take decades, even centuries. This is visible in the 300-year evolution plotted above, and in the full data-set linked below. Attempts to speed up the transition create the paradox of very high costs or potential bubbles. We have also compiled a helpful guide into transition timings by mapping twenty prior technology transitions. Our recent research, summarized below, covers all of these topics, for further information.
Source: Wrigley, E. A. (2011). Energy and the English Industrial Revolution, Cambridge, TSE Estimates. With thanks to the Renewable Energy Foundation for sharing the data-set.