-
Biden presidency: our top ten research reports?
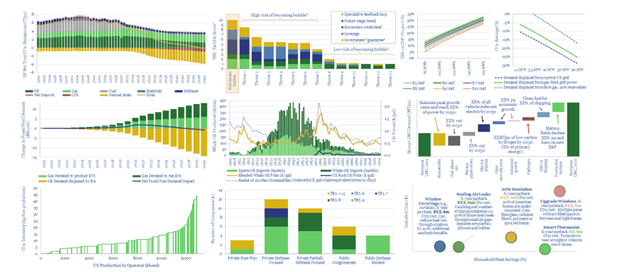
Joe Biden’s presidency will prioritize energy transition among its top four focus areas. Thus we present our top ten pieces of research that gain increasing importance as the new landscape unfolds. We are cautious on bubbles and supply shortages. But decision-makers will become more discerning around CO2.
-
Energy transition: is it becoming a bubble?
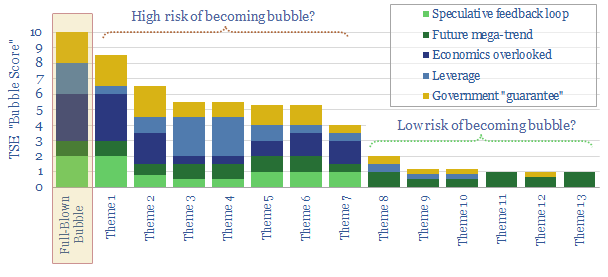
Investment bubbles in history typically take 4-years to build and 2-years to burst, as asset prices rise c815% then collapse by 75%. There is now a frightening resemblance between energy transition technologies and prior investment bubbles. This 19-page note aims to pinpoint the risks and help you defray them.
-
What oil price is best for energy transition?
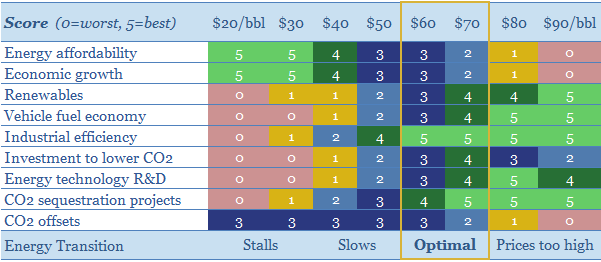
$30/bbl oil prices stall the energy transition. They kill the relative economics of electric vehicles, renewables, industrial efficiency, flaring reductions, CO2 sequestration and new energy R&D. This 15-page note finds $60/bbl oil is ‘best’ for decarbonization. Policymakers should target $60 oil.
-
Energy Transition: Polarized Perspectives?
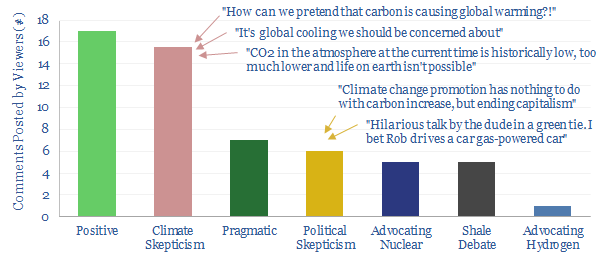
Last year, we appeared on RealVision, advocating economic opportunities that can decarbonize the energy system. The “comments” surprised us, suggesting the topic of energy transition is extremely polarized. Historically, such ideological polarization has not ended well. This re-affirms the need for energy technologies.
-
Global gas: catch methane if you can?
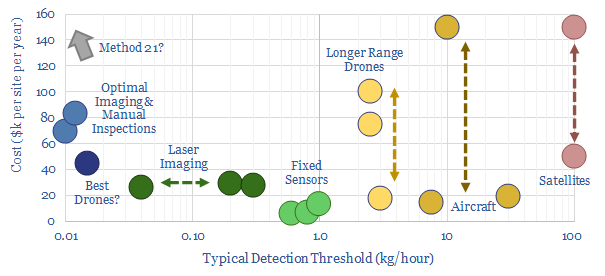
Scaling up natural gas is among the largest decarbonisation opportunities. But this requires minimising methane leaks. Exciting new technologies are emerging. This 28-page note ranks producers, positions for new policies and advocates developing more LNG. To seize the opportunity, we also identify 35 companies geared to the theme. Global gas demand will not be derailed…
-
Robot delivery: Unbelievable fuel economy…
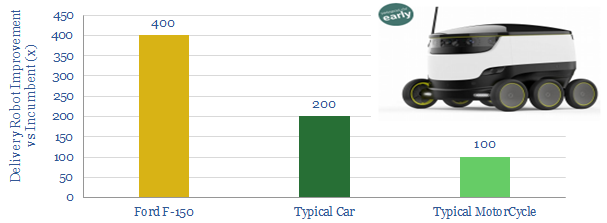
Small delivery robots can achieve 100-400x higher fuel economies than conventional, oil-powered vehicles. We profile Starship, whose fleet is now covering c400km/day. Energy demand in transportation is evolving.
-
Lost in the Forest?
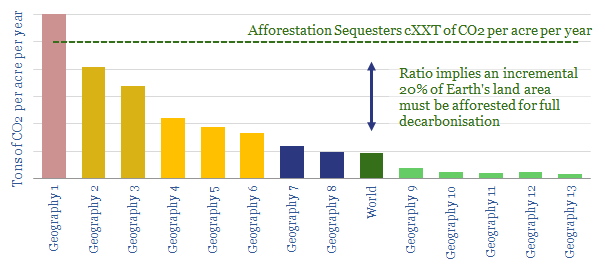
In 2019, Shell pledged $300M of new investment into forestry. TOTAL, BP and Eni are also pursuing similar schemes. But can they move the needle for CO2? In order to answer this question, we have tabulated our ‘top five’ facts about forestry. We think Oil Majors may drive the energy transition most effectively via developing…
-
Aerial Ascent: why flying cars fly
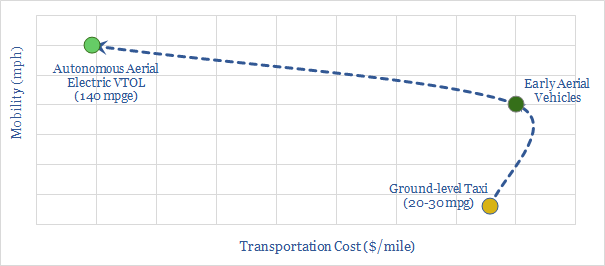
Aerial vehicles will do in the 2020s what electric vehicles did in the 2010s: going from a niche technology to a global mega-trend that no forecaster can ignore, improving mobility by 100x. The technology is advancing rapidly. Fuel economies and costs are transformational. Aerial vehicles accelerate the energy transition.
-
Oil Companies Drive the Energy Transition?
There is only one way to decarbonise the energy system: leading companies must find economic opportunities in better technologies. No other route can source sufficient capital to re-shape the industry. We outline seven game-changing opportunities. Remarkably, leading energy Majors are already pursuing them.
-
Why the Thunder Said?
Energy transition is underway. Or more specifically, five energy transitions are underway at the same time. They include the rise of renewables, shale oil, digital technologies, environmental improvements and new forms of energy demand. This is our rationale for establishing a new research consultancy, Thunder Said Energy, at the nexus of energy-technology and energy-economics.
Content by Category
- Batteries (89)
- Biofuels (44)
- Carbon Intensity (49)
- CCS (63)
- CO2 Removals (9)
- Coal (38)
- Company Diligence (95)
- Data Models (840)
- Decarbonization (160)
- Demand (110)
- Digital (60)
- Downstream (44)
- Economic Model (205)
- Energy Efficiency (75)
- Hydrogen (63)
- Industry Data (279)
- LNG (48)
- Materials (82)
- Metals (80)
- Midstream (43)
- Natural Gas (149)
- Nature (76)
- Nuclear (23)
- Oil (164)
- Patents (38)
- Plastics (44)
- Power Grids (130)
- Renewables (149)
- Screen (117)
- Semiconductors (32)
- Shale (51)
- Solar (68)
- Supply-Demand (45)
- Vehicles (90)
- Wind (44)
- Written Research (355)
