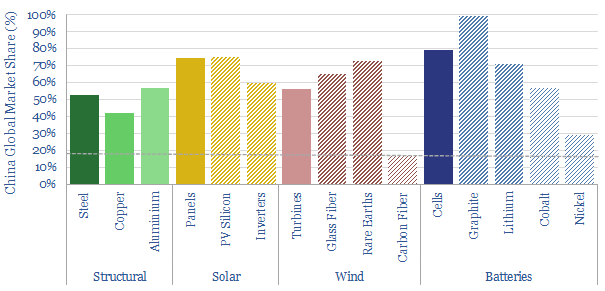
East to West: re-shoring the energy transition?

re-shoring the energy transition

China is 18% of the world’s people and GDP. But it makes c50% of the world’s metals, 60% of its wind turbines, 70% of its solar panels and 80% of its lithium ion batteries. Re-shoring the energy transition will likely be a growing motivation after events of 2022. This 14-page note explores resultant opportunities.


World events in 2022 have created a new appetite for self-reliance; avoiding excessive dependence upon particular suppliers, in case that relationship should sour in the future. China’s exports are 5x Russia’s. And it dominates supply chains that matter for the energy transition. The trends and market shares are quantified on pages 2-4.

There are five challenges that must be overcome, in order to re-shore value chains from China to the West: input materials, energy costs, 2-3 re-inflation risks, dumping and general Western NIMBY-ism. We outline each challenge on pages 5-6.

Re-shoring the energy transition and its best opportunities are summarized, looking across all of our research, for metals and materials (page 7), wind (page 8), solar (page 9) and batteries (pages 10-11). In each case, where would be the most logical to site the infrastructure, and which companies are involved?

An unexpected implication of re-shoring these value chains is that their underlying energy demand would be re-shored too. Our current base case is that Western energy demand per capita has peaked and Western oil demand is in absolute decline. These markets may be re-shaped, with resultant opportunities for infrastructure investors (pages 12-14).

For an outlook on China’s coal industry and how we compare Chinese coal companies to Western companies, please see our article here.

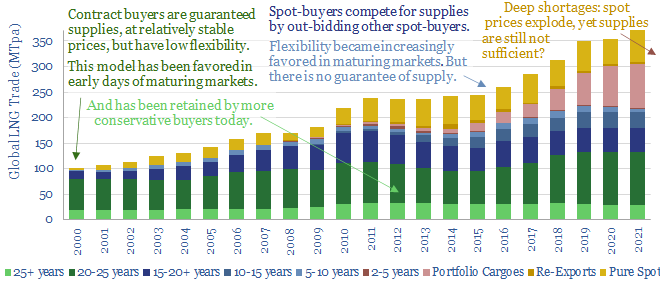
Energy security: the return of long-term contracts?

Energy commodities

Spot markets have delivered more and more ‘commodities on demand’ over the past half-century. But is this model fit for the energy transition? Many markets are now desperately short, causing explosive price rises. And sufficient volumes may still not be available at any price. So this 13-page note on energy commodities considers a renaissance for long-term contracts and who might benefit?


Liquid spot markets have long been seen as the apotheosis of commodities. Over time, small and immature markets are supposed to graduate towards ever-greater liquidity. Ultimately, the entire market is to be bought and sold at the prevailing prices on some highly liquid exchange, where any seller in the market can reach any buyer in the market, and vice versa. It is a kind of “commodities on demand” model. The history and evolution of this model is laid out on pages 2-3. But 2022 is showing its limitations.

Challenge #1 for liquid spot markets is that prices can explode in a shortage. We review energy costs, price elasticity factors, and their consequences on pages 4-6.

Challenge #2 for liquid spot markets is that even after prices explode, sufficient supplies may still not be available at any price. We zoom in on LNG as an example on pages 7-8. A country that has 90% of its supplies locked in on contracts is clearly going to fare very differently in 2022-23 than one that had planned to source 90% of its supplies from the spot market.

Challenge #3 is securing future supplies amidst uncertainty. No one wants to finance a 20-year project where prices could collapse, volumes could collapse or the commodity in question could even be banned outright. As an OPEC oil minister recently stated “it isn’t going to work like that”.

Could all of this point to a renaissance for long-term contracts? On pages 11-13, we outline what this might look like, who might benefit, and some possible pushbacks.

For an outlook on our top 10 energy commodities with upside in the energy transition, please see our article here.

US shale: our outlook in the energy transition?

US shale outlook in the Energy Transition

This presentation covers our outlook for the US shale industry in the energy transition, and was presented at a recent investor conference. The presentation is free to download for TSE subscription clients.


The importance of shale oil supplies in a fully decarbonized energy system is contextualized on pages 1-7. Production must grow by a vast 2.6Mbpd in 2022-25 to keep oil markets well supplied, even as oil demand plateaus. Otherwise, devastating oil shortages may de-rail the transition.

This requires a 5% CAGR in shale productivity. We argue in favor of future productivity growth, based on the evidence from 950 technical papers, which we have reviewed, on pages 8-12.

But can the industry attract capital? This now hinges upon carbon credentials. Laggards will have >25kg/boe of upstream CO2 while leaders have the opportunity to be CO2-neutral. The division (and the  prize) is outlined on pages 13-19.

Our conclusions for the US Shale outlook in the energy transition, based on technology productivity and CO2, are summarised in our presentation here.

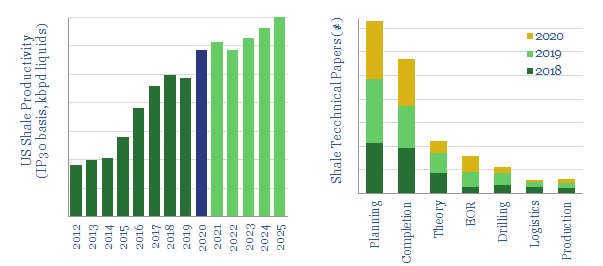
US Shale: the second coming?

Future US shale productivity

Future US shale productivity can still rise at a 5% CAGR to 2025, based on evaluating 300 technical papers from 2020. The latest improvements are discussed in this 12-page note, and may spark more productivity gains than any prior year. Thus unconventionals could grow by 2.6Mbpd per annum from 2022-25 to quench deeply under-supplied oil markets. But hurdles remain. The leading technologies are also becoming concentrated in the hands of fewer operators and an emerging group of oil services.


Our production forecasts for US shale are outlined on pages 2-3. Volumes must double by 2025 to rebalance future oil markets, which hinges on productivity gains.

Our outlook for shale productivity is explained on page 4, including our methodology, which considers the pace of progress in technical papers.

Headline comparisons are presented on pages 5-6, between the technical papers filed around the shale industry in 2018, 2019 and 2020.

The latest improvements are summarized across each category, drawing on the most interesting technical papers and the companies that have filed them. This includes petrophysics (page 7), completion designs (page 8), optimizing completion fluids (page 8), Shale-EOR (page 9) and a step-change in machine learning algorithms (page 10-11).

The leading companies are highlighted on page 12, ranked according to the numbers of technical papers they have filed in each year. Some are stepping up, and gaining an edge, while others are clearly pulling back on shale R&D.

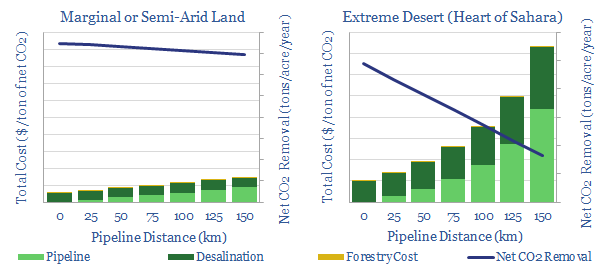
Green deserts: a final frontier for forest carbon?

afforesting lands by desalinating and distributing seawater

Forests can offset 15bn ton of CO2 per year from 3bn global acres. But is there potential to afforest any of the world’s 11bn acres of arid and semi-arid lands, by desalinating and distributing seawater? Our 18-page note answers this question. While the energy economics do not work in the most extreme deserts (e.g., the Sahara), $60-120/ton CO2 prices may be sufficient in semi-arid climates, while the best economics of all use waste water from oil and gas, such as in the Permian basin.


The opportunity and challenges for nature based solutions to climate change are outlined on pages 2-4, explaining the rationale for afforesting deserts.

Precedents for afforesting deserts, including detailed case studies from the Academic literature, are reviewed on pages 5-8.

Water requirements are quantified, based on data from 60 tree species and the forestry industry, on pages 9-10.

The energy economics of desalinating and piping water are presented on pages 11-12.

The challenges of afforestation in the most extreme desert environments are modelled on page 13, showing why it is almost impossible to grow forests in the Sahara. The CO2 costs of supplying sufficient water could exceed the CO2 absorbed by new trees.

Supplementing rainfall in marginal lands is a more compelling economic model (e.g., adding the equivalent of 100mm new rainfall to marginal lands with c300-400mm), as shown on page 14.

The best case we can find is to use Permian waste water. Costs of desalination could be lower than current costs of disposal, while Permian upstream operations on the reforested acreage could be made carbon neutral, per pages 16-17.

A short list of companies exposed to the theme is presented on page 18.

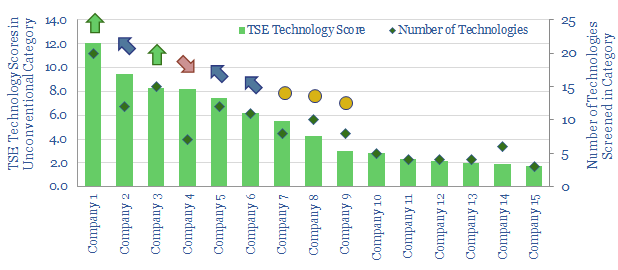
US shale: the quick and the dead?

Top US shale companies

It is no longer possible to compete in the US shale industry without leading digital technologies. This 10-page note outlines best practices, process by process, based on 500 patents and 650 technical papers. Chevron, Conoco and ExxonMobil lead our screens. We profile where they have an edge, to capture upside in the industry’s dislocation and recovery. Disconcertingly absent from the leader-board is EOG, whose long-revered technical edge may now have been eclipsed by others.

Qnergy: reliable remote power to mitigate methane?

remote power to mitigate methane

This short note profiles Qnergy, the leading manufacturer of Stirling-design engines, which generate 1-10 kW of power, for remote areas, where a grid connection is not available. The units are particularly economical for mitigating methane emissions, with a potential abatement cost of $20/ton of CO2-equivalents avoided.


750,000 bleeding pneumatic devices around the oil and gas industry are the largest single source of methane leaks, with each medium-bleed device leaking an average of 1.5T of methane per year, comprising 35% of the oil and gas industry’s total emissions (chart below, data here).

We have screened the US onshore space, operator-by-operator, acreage position by position, to see who most urgently needs to replace bleeding pneumatics (chart below, data here, note here). But how will they be replaced?

The challenge is power. An 8-well pad will typically require 2kW of electricity, which is low because the pneumatic pressure of natural gas is used in control and actuation of valves. The power demands rise to 4kW if compressed air is used in lieu of methane. Compressed air is reliable, easy to retrofit and does not cause warming when it bleeds into the atmosphere. But a compressor is needed, and the compressor needs to be powered (below).

Qnergy’s Powergen product uses a Stirling engine to generate electricity from heat. It is fuel agnostic and can run on waste heat or in-basin gas.

The PowerGen product was launched in 2017 and its adoption has been growing at a 300% CAGR. The company now also manufactures and sells compressed air pneumatic devices, which will be powered by its Stirling engines. The 5,650 series generates 5.7kW of power from 1.4mcfd of gas inputs (implying c30% thermal efficiency).

NASA has accredited the design as the most reliable ever invented for a heat engine. One of the first units has now run for 24,000 hours without requiring maintenance (equivalent to driving a car to the moon and back 2x). Design life is estimated at over 60,000 hours (7-years). The engine runs between -40C in Alaska and 60C desert installations. Each unit is also remotely monitored, with live support, for preventative maintenance and to detect issues.

Total cost of ownership for Stirling’s Powergen is cited as the lowest cost power solution to replace bleeding pneumatic devices: costing $100k for Qnergy unit, $150k for a microturbine, $320k for a combination of renewable power and fuel cells, and c$380k for a thermo-electric alternative.

Emissions reductions from each Qnergy Powergen unit saves 325T of CO2e-emissions per annum, while powering each unit will emit 25T of CO2e, for a net saving of 300T/CO2e. At a total cost of $100k, this implies a CO2 abatement cost of $20/ton over a c15-year life of a Qnergy Powergen unit.

For our published screen of companies in methane mitigation, please see our data-file here.

For Qnergy’s latest presentation, see the video below, and please let us know if we can helpfully introduce you to the team at Qnergy.

Chevron: SuperMajor Shale in 2020?

Chevron Shale Technologies

SuperMajors’ shale developments are assumed to differ from E&Ps’ mainly in their scale and access to capital. Superior technologies are rarely discussed. But new evidence is emerging. This 11-page note assesses 40 of Chevron’s shale patents from 2019, showing a vast array of data-driven technologies, to optimize every aspect of unconventionals.


Page 2 explains how we assessed Chevron’s shale patents, to identify technologies that could support guidance for 900kboed of Permian production by 2023.

Page 3 sets out Chevron’s technologies for shale exploration and appraisal, based on recent seismic patents.

Page 4 sets out Chevron’s technologies for shale drilling, based on recent patents, many of which are co-filed with Halliburton, around a specific innovation.

Pages 5-8 set out Chevron’s technologies for shale completions, through an array of sophisticated, proprietary and increasingly digital technologies. These will not only help in the Permian, but also in de-risking international basins.

Page 8 sets out Chevron’s potential edge in completion fluids. We are particularly excited by the promising results from field-tests of anionic surfactants.

Page 9 sets out Chevron’s data-driven flowback practices, including productivity gains from field tests in the Vaca Muerta.

Pages 10-11 set out Chevron’s technologies for upgrading NGLs into gasoline-, jet- and diesel-range products, using industry-leading ionic liquid catalysts.

Page 11 concludes with implications for the broader shale industry.

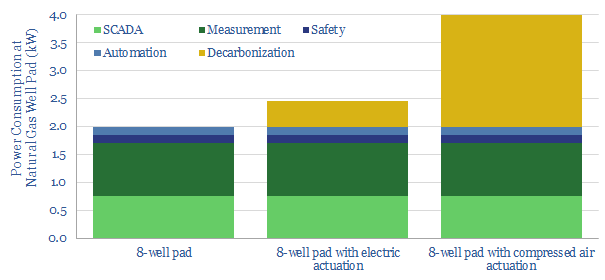
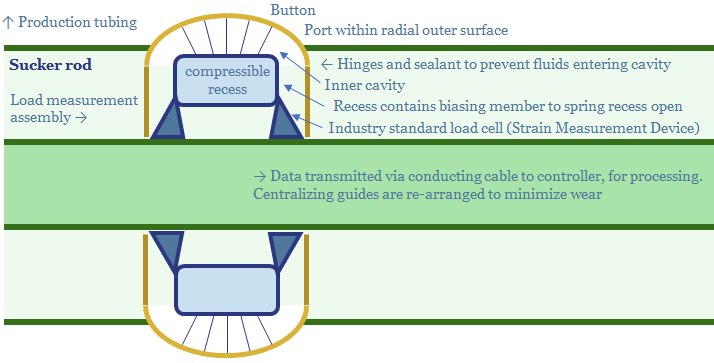
EOG’s Digitization: Pumped-Up?

EOG's digitization patent

EOG patented a new digital technology in 2019: a load assembly which can be built into its rod pumps: to raise efficiency, lower costs and lower energy consumption. This 8-page note reviews the patent, illustrating how EOG is working to further digitize its processes, maximise productivity and minimise CO2 intensity.


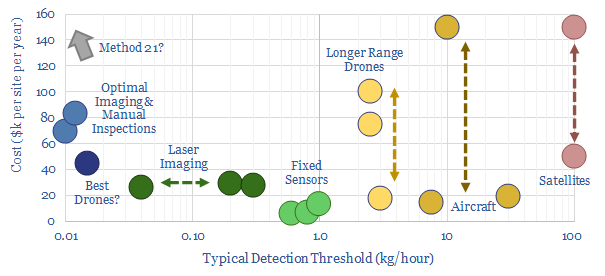
Global gas: catch methane if you can?

methane leaks

Scaling up natural gas is among the largest decarbonisation opportunities on the planet. But this requires minimising methane leaks. Exciting new technologies are emerging. This 30-page note ranks producers, positions for new policies and advocates developing more LNG. To seize the opportunity, we also identify c25 early-stage companies and 10 public companies in methane mitigation. Global gas demand should treble by 2050 and will not be derailed by methane leaks.

This overview note was first published in 2019, then updated in Feb-2021 and September-2022, to add further case studies, companies and market updates. It contains all our latest views on methane mitigation, in a single, comprehensive resource.


Pages 2-5 explain why methane matters for climate and for the scale up of natural gas. If 3.5% of methane is leaked, then natural gas is, debatably, no greener than coal.

Pages 6-9 quantify methane emissions and leaks across the global gas industry, including a granular breakdown of the US supply-chain, based on asset-by-asset data.

Page 10-11 outlines the incumbent methods for mitigating methane, plus our screen of 34 companies which have filed 150 recent patents for improved technologies.

Pages 12-13 outline the opportunity for next-generation methane sensors, using LiDAR and laser spectroscopy, including trial results and exciting companies.

Pages 14-15 outline the opportunity for next methane sensors, using AI and other ambient data, with a case study that likely offers detection costs below $10/ton CO2e.

Pages 16-18 cover the best new developments in drones and robotics for detecting methane emissions at small scale, including three particularly exciting companies.

Pages 19-20 outline next generation satellite technologies, which will provide a step-change in pinpointing global methane leaks and repairing them more quickly.

Pages 21-27 cover the changes underway in the oilfield supply chain, to prevent fugitive methane emissions, highlighting interesting companies and innovations.

Page 28-29 screens methane emissions across the different Energy Majors, and resultant CO2-intensities for different gas plays.

Page 30 advocates new LNG developments, particularly small-scale LNG, which may provide an effective, market-based framework to mitigate most methane.

Our underlying data-files into methane mitigation are also available to be viewed individually, in chronological order, covering company screens, technology reviews and leakage rate data.

Copyright: Thunder Said Energy, 2019-2024.