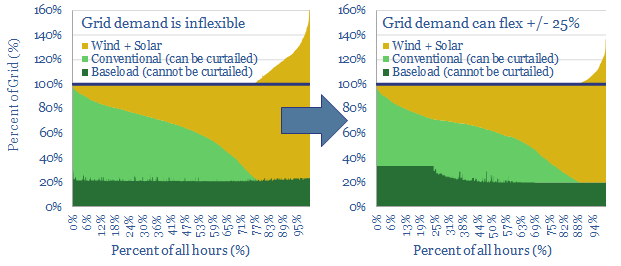
25% of the power grid could realistically become ‘flexible’, shifting its demand across days, even weeks. This is the lowest cost and most thermodynamically efficient route to fit more wind and solar into power grids. We are upgrading our renewables ceilings from 40% to 50%. This 22-page note outlines the growing opportunity in demand shifting.
Renewables would struggle to reach 50% penetration of today’s grids, due to their volatility. Pages 2-7 quantify the challenges, which include capacity payments for non-renewable back-ups, negative power pricing >20% of the time, >10% curtailment and 30% marginal cost re-inflation for new projects.
But a greater share of renewables would help decarbonization. This objective is explained on page 8, showing the relative costs and CO2-intensities of electricity technologies.
Renewable electricity storage is not the solution. It is costly and thermodynamically inefficient, which actually dilutes the impact of renewables. Costs and efficiency losses are quantified for batteries and for hydrogen on pages 9-11.
Demand shifting is a vastly superior solution. Pages 12-17 outline half-a-dozen demand-shifting opportunities that have been profiled in our research to-date. Companies in the smart energy supply chain are also noted and screened.
What impacts? We model that up to 25% of the grid can ultimately be demand-flexible, while this can help accommodate an additional 10pp share for renewables in the grid, before extreme volatility begins to bite (see pages 18-19).
Europe leads, and we now assume renewables can reach 50% of its power grid by 2050, with follow-through consequences for our gas and power models (page 20).
Our global renewables forecasts are not upgraded, as the bottleneck on a global basis is simply annual capacity additions, which must treble between 2020 and 2050, in our roadmap to ‘net zero’. (pages 21-22).
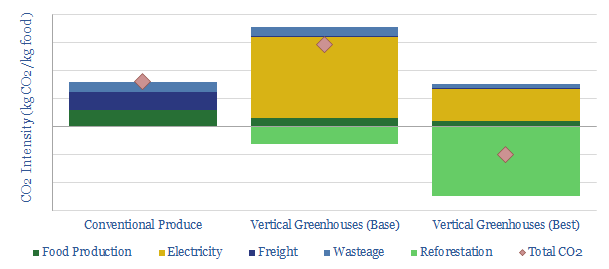
Vertical greenhouses achieve 10-400x greater yields per acre than field-growing, by stacking layers of plants indoors, and illuminating each layer with LEDs. Economics are exciting. CO2 intensity varies. But it can be carbon-negative in principle. This 17-page case study illustrates how supply chains are localizing and more renewables can be integrated into grids.
The first rationale for vertical greenhouses is to grow food closer to the consumer, which can save 0.6kg of trucking CO2 per kg of food. Eliminating freight is much simpler than decarbonizing freight (pages 2-4).
The second rationale for vertical greenhouses is that they are 10-400x more productive per unit of land, hence they can free up farmland for reforestation projects that absorb CO2 from the atmosphere (pages 5-6).
The third rationale for vertical greenhouses is that their LED lighting demands are flexible, which means they can absorb excess wind and solar, in grids that are increasingly laden with renewables. They are much more economical at achieving this feat than batteries or hydrogen electrolysers (pages 7-10).
The overall CO2 intensity of vertical greenhouses depends on the underlying grid’s CO2 intensity, but the process can in principle become carbon negative (pages 11-13).
Interestingly, we also think vertical greenhouses can smooth our volatile power grids by demand shifting.
The economics are exciting. We model 10% IRRs selling fresh produce at competitive prices, with upside to 30% IRRs if fresher produce earns a premium or operations can be powered with low-cost renewables when the grid is over-saturated (pages 14-15).
Leading companies in vertical greenhouses and in their supply chain are discussed on pages 16-17.
UK wind power has almost trebled since 2016. But its output is volatile, now varying between 0-50% of the total grid. Hence this 14-page note assesses the volatility, using granular, hour-by-hour data from 2020. EV charging and smart energy systems screen as the best new opportunities. Gas-fired backups also remain crucial to ensure grid stability. The outlook for grid-scale batteries has actually worsened. Finally, downside risks are quantified for future realized wind power prices.
This rise of renewables in the UK power grid is profiled on page 2, showing how wind has displaced coal and gas to-date.
But wind is volatile, as is shown on page 3, thus the hourly volatility within the UK grid is 2.5x higher than in 2016.
Power prices have debatably increased due to the scale-up of wind, as shown on page 4.
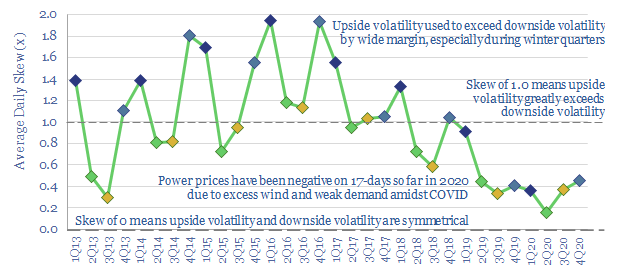
But price volatility measures are mixed, as presented on pages 5-6. We conclude that the latest data actually challenge the case for grid-scale batteries and green hydrogen.
Downside volatility has increased most, as is quantified on pages 7-8, finding a vast acceleration in negative power pricing, particularly in 2020.
The best opportunities are therefore in absorbing excess wind power. EV charging and smart energy systems are shown to be best-placed to benefit, on pages 9-10.
Upside volatility in power prices has not increased yet, but it will do, if gas plants shutter. The challenge is presented on pages 11-13, including comparisons with Californian solar.
Future power prices realized by wind assets are also likely to be lower than the average power prices across the UK grid, as is quantified on page 14. This may be a risk for unsubsidized wind projects, or when contracts for difference have expired.
Investment bubblesin history typically take 4-years to build and 2-years to burst, as asset prices rise c815% then collapse by 75%. In the aftermath, finances and reputations are both destroyed. There is now a frightening resemblance between energy transition technologies and prior investment bubbles. This 19-page note aims to pinpoint the risks and help you defray them.
Our rationale for comparing energy transition to prior investment bubbles is contextualized on page 2, based on discussions we have had with investors and companies in 2020.
Half-a-dozen historical bubbles are summarized on pages 3-4, in order to compare the energy transition with features of Dutch tulips, the South Sea and Mississippi Companies, British Railway Mania, Roaring Twenties, Dot Com bubble and sub-prime mortgages.
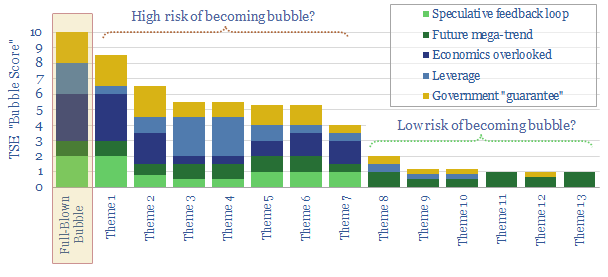
Five common features of all bubbles are considered in turn on pages 5-16. In each case, we explain how the feature contributed to past bubbles, and where there is evidence of the feature in different energy transition technologies.
Important findings are that many themes of the energy transition can achieve continued deflation or profitability, but not both; while a combination of increasing leverage and curtailment on renewables assets could leave many assets underwater.
Implications are drawn out on pages 17-19, including five recommendations for decision-makers to find opportunities and avoid the most dangerous aspects of bubbles surrounding the energy transition.
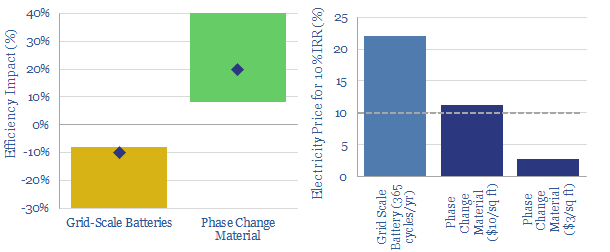
Phase change materials could be a game-changer for energy storage. They absorb (and release) coldness when they freeze (and melt). They can earn double digit IRRs unlocking c20% efficiency gains in freezers and refrigerators, which make up 9% of US electricity. This is superior to batteries which add costs and incur 8-30% efficiency losses. We review 5,800 patents and identify early-stage companies geared to the theme in our new 14-page note.
Refrigerators and freezers comprise 9% of the US electric grid, of which half is in the commercial sector, across 4,200 warehouses, 40,000 supermarkets and 620,000 restaurants. This report argues that a new class of materials, Phase Change Materials (PCMs), can effectively store excess renewable energy as coldness in these fridges and freezers (aka “demand shifting“), improving their efficiency by c20% and without requiring power prices to increase.
The energy economics of cold storage are explained on pages 2-4, outlining the energy consumption of cold storage facilities as function of different input variables (which will also help you understand how to save energy at your fridge-freezer at home) .
Phase change materials are explained on pages 5-6, explaining what they are, how they work, and how they can lower energy consumption by c20% at a typical fridge/freezer.
The economics are modelled on pages 7-8, showing an 8.5% IRR under recent costs and power prices, rising into double digits with a CO2 price, and above 30% with recent deflation in the costs of PCMs.
A comparison with battery storage is provided on page 9-10, showing a clear preference for PCMs. Batteries decrease efficiency and raise electricity costs. PCMs increase efficiency and do not raise electricity costs. Batteries have further challenges.
Who are the leading companies commercialising PCMs? We answer this question on pages 11-14, by reviewing 5,800 patents. We find promising venture-stage and growth-stage companies in the space, plus listed companies in the capital goods, materials and automotive sectors.
We presented our ‘Top Ten Themes for Energy in the 2020s’ to an audience at Yale SOM, in February-2020. The audio recording is available below. The slides are available to TSE clients, in order to follow along with the presentation.
Please sign up to our distribution list, to receive our best ideas going forwards…
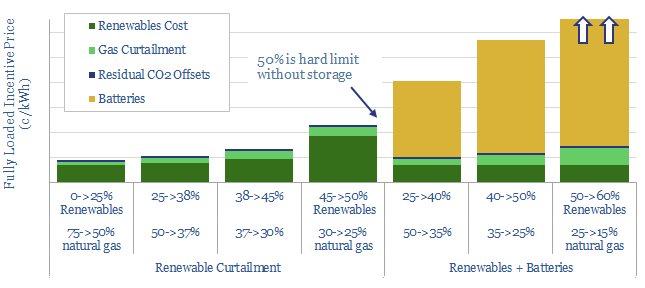
What should future power grids look like?Our 24-page note optimizes cost, resiliency and CO2, using a Monte Carlo model. Renewables should not surpass 45-50%. By this point, over 70% of new wind and solar will fail to dispatch, while incentive prices will have trebled. Batteries help little. They raise power prices by a further 2-5x to accommodate just 3-15% more renewables. The lowest-cost, zero-carbon power grid, we find, comprises c25% renewables, c25% nuclear and c50% decarbonized gas, with an incentive price of 9c/kWh.
Pages 2-4 illustrate the volatility of wind and solar generation at today’s grid penetration, providing rules of thumb around intermittency.
Pages 5-6 illustrate the strange consequences once renewables surpass 25% of the grid, including curtailment, negative power pricing and financing difficulties.
Pages 7-9 quantify and explain how much curtailment will take place in a typical grid as renewables scale from 25% to 40%, 50% and 60% of gross generation, using a Monte Carlo approach. The model shows when and why curtailment is occurring.
Pages 10-20 quantify and explain the costs of batteries, to backstop renewables as they scale from 25%, to 40%, 50% and 60% of the grid, while avoiding curtailment. Real world conditions are not conducive to competitive battery economics.
Pages 21-23 quantify the residual reliance on natural gas. Amazingly, even our most aggressive battery scenarios only permit 10% of gas-power capacity to be shuttered. Low-utilization gas is costly. High-utilization gas is less costly. And the economics of decarbonized gas are superior to any renewables plus batteries combination.
Page 24 concludes that natural gas will emerge as the ‘best battery’ to backstop renewables, estimating the most likely shares in an optimal power mix.
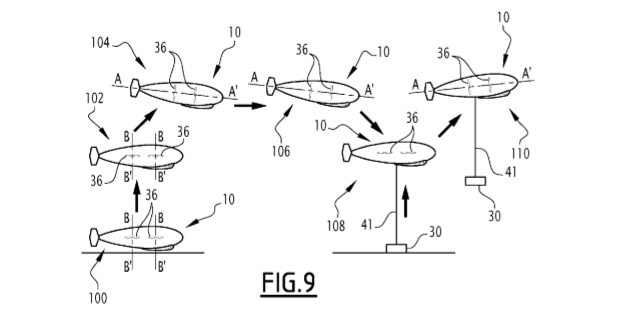
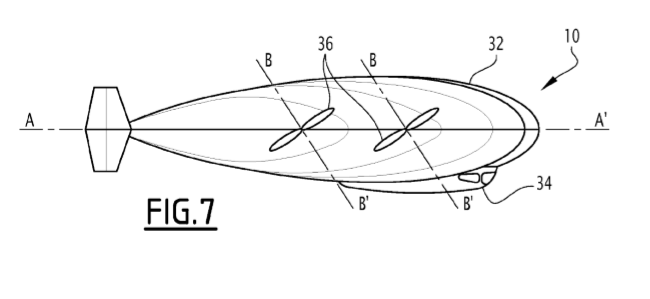
In 2019, TOTAL co-filed two patents with an airship-technology company, Flying Whales, aiming to lower the logistical costs of moving capital equipment into remote areas. An example is shown above. The LCA60T is envisaged to carry up to 60T of cargo (c4x the capacity of a truck), with a range of 100-1,000km. This short note assesses the opportunity, and whether these new airships could displace trucks, or lower diesel demand. We are most excited by the impact for onshore wind.
[restrict]
Flying Whales is a French company, originally supported by the French Public Forest Office, to progress transportation technologies that could help evacuate timber. It has since raised €200M, including from BPI and Chinese backers.
Designs for the LCA60T are shown below, from TOTAL and Flying Whales’ patent. The ship is 154m x 68m, constructed from rigid carbon-fiber composite, generating aerostatic lift from 10, unpressurised cells of helium.
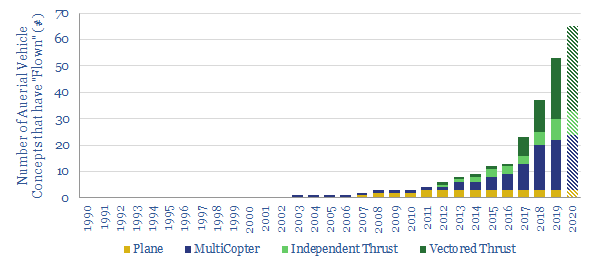
Its distributed electric propulsors are similar to those in the flying car concepts that excite us. We recently re-assessed our rankings of different flying car concepts here.
Technical Readiness is at Level 5-6, but rapid progress is foreseen: Wind-tunnel testing in 2019, the first test phase in 2020, the first prototype flight in 2021. Flying Whales company plans to construct a plant in Bordeaux, for €90M, to produce 12 airships per year by 2022, ramping up to €5bn of sales within 10-years, from constructing 150 airships in France and China.
What Advantages?
Airships can rapidly reach places that trucks cannot, particularly in remote areas without naviable roads. They are helped by vertical take-off and landing (VTOL), and a system of a dozen winches, that can lower cargoes.
Airships can also carry large loads, up to 60T, at speeds up to 100kmph. For comparison, a typical truck carries c14T, a Sikorsky S-64 SkyCrane carries 9T and the largest Russian Mil Mi-26 helicopters can carry 20T.
Economics are better than helicopters. Flying Whales estimates that its deliveries could be 20x less expensive than helicopters, which can cost c$1M/day or at least $11,000/hour. The Flying Whales should cost c$50,000/day, which perhaps translates into c$5,000/hour. This is still much more pricey than a truck ($60-200/hour), making Flying Whales best suited to large loads in remote locations. The technology is unlikely to replace trucks on highways.
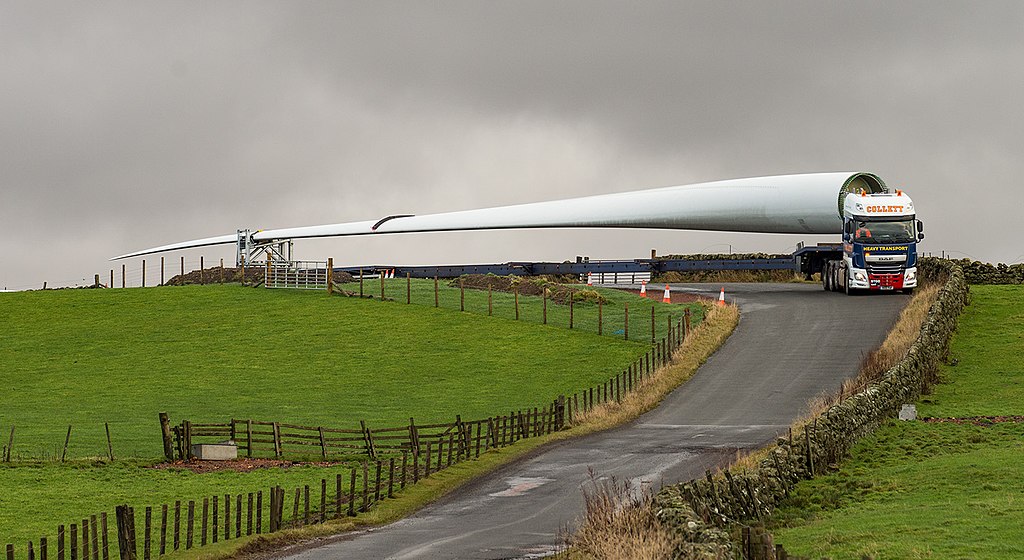
Wind turbines? Where these capabilities may best come together is in the delivery of wind turbine blades, where the logistics can be notoriously challenging (chart below). All three turbine blades could in principle be delivered as a single Flying Whales Cargo, slashing the c$30,000-100,000 delivery costs per turbine, that can be incurred in the onshore wind industry.
What Energy Economics?
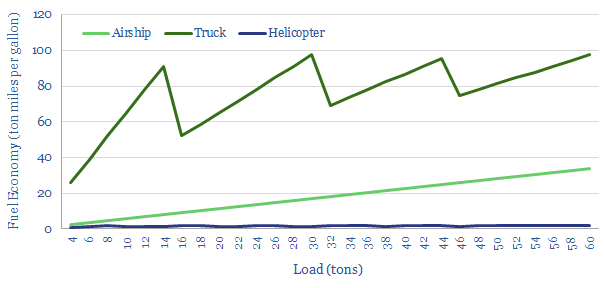
The energy economics of Flying Whales’ airships should be a great improvement on helicopters, but still fall short of trucks, we estimate.
Specifically, the Flying Whales airships consume 1.5MW at peak cruise speeds around 100kmph. This power consumption is equivalent to c100 gallons of diesel per hour, fed into a diesel generator, which in turn feeds the propulsion units. Total fuel economy thus runs at 30 ton-miles per gallon (chart below).
By contrast, we estimate helicopters consume c5,000 gallons of jet fuel per hour, for fuel economies of 1.5 ton-miles per hour.
But trucks consume only c10 gallons of diesel per hour, for a fuel economy of c67 ton-miles per gallon.
Fuel consumption may also be higherfor large airships, during strong gusts of wind. To stabilize the Airships, they will contain 3MW ultracapacitors, to provide bursts of energy.
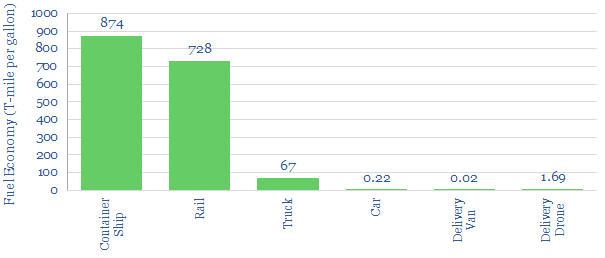
The most efficient freight delivery method remains via container ships and trucks, according to our data-file (chart below), which now also includes the calculations above for Airships.
We conclude that new airships may help deflate delivery costs in remote locations: particularly for onshore oil and gas, onshore wind and niches in the construction sector. But they are unlikely to displace materialy volumes of diesel demand, which remain in our models of long-run oil demand (chart below).
Source: Kuhlmann, H. F., (2019). Method for Transporting a Payload to a Target Location and Related Hybrid Airship, Patent WO2019092471A1
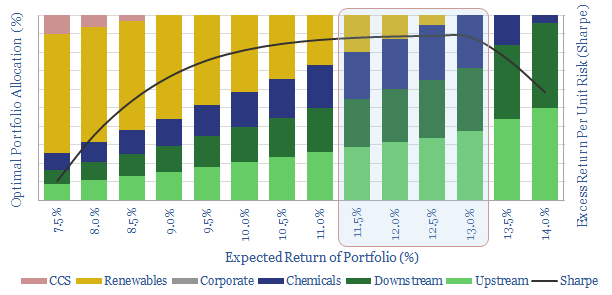
It is often said that Oil Majors should become Energy Majors by transitioning to renewables. But what is the best balance based on portfolio theory? Our 7-page note answers this question, by constructing a mean-variance optimisation model. We find a c0-20% weighting to renewables maximises risk-adjusted returns. The best balance is 5-13%. But beyond a c35% allocation, both returns and risk-adjusted returns decline rapidly.
Pages 2-3 outline our methodology for assessing the optimal risk-adjusted returns of a Major energy company’s portfolio, including the risk, return and correlations of traditional investment options: upstream, downstream and chemicals.
Page 4 quantifies the lower returns that are likely to be achieved on renewable investment options, such as wind, solar and CCS, based on our recent modeling.
Pages 5-6 present an “efficient frontier” of portfolio allocations, balanced between traditional investment options and renewables, with different risk and return profiles.
Pages 6-7 draw conclusions about the optimal portfolios, showing how to maximise returns, minimise risk and maximise risk-adjusted returns (Sharpe ratio).
The work suggests oil companies should primarily remain oil companies, working hard to improve the efficiency and lower the CO2-intensities of their base businesses.
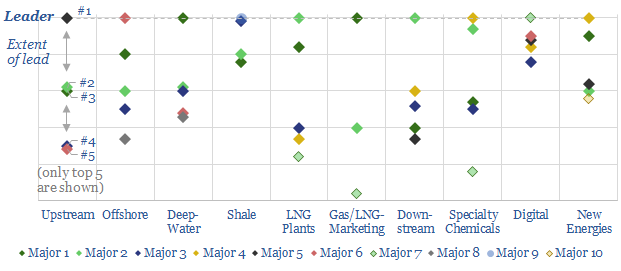
Technology leadership is crucial in energy. It drives costs, returns and future resiliency. Hence, we have reviewed 3,000 recent patent filings, across the 25 largest energy companies, in order to quantify our “Top Ten” patent leaders in energy.
https://vimeo.com/357450011
This 34-page note ranks the industry’s “Top 10 technology-leaders”: in upstream, offshore, deep-water, shale, LNG, gas-marketing, downstream, chemicals, digital and renewables.
For each topic, we profile the leading company, its edge and the proximity of the competition.
Companies covered by the analysis include Aramco, BP, Chevron, Conoco, Devon, Eni, EOG, Equinor, ExxonMobil, Occidental, Petrobras, Repsol, Shell, Suncor and TOTAL.
Upstream technology leaders have been discussed in greater depth in our April-2020 update, linked here.
More information? Please do not hesitate to contact us, if you would like more information about accessing this document, or taking out a TSE subscription.
Cookies?
This website uses necessary cookies. Our cookies are simply to improve your experience. We do not undertake any advertising or targeting via our cookies. By clicking 'accept' or continuing to use the website, you consent to our use of cookies.AcceptRead More
Privacy & Cookies Policy
Privacy Overview
This website uses cookies to improve your experience while you navigate through the website. Out of these, the cookies that are categorized as necessary are stored on your browser as they are essential for the working of basic functionalities of the website. We also use third-party cookies that help us analyze and understand how you use this website. These cookies will be stored in your browser only with your consent. You also have the option to opt-out of these cookies. But opting out of some of these cookies may affect your browsing experience.
Necessary cookies are absolutely essential for the website to function properly. This category only includes cookies that ensures basic functionalities and security features of the website. These cookies do not store any personal information.
Any cookies that may not be particularly necessary for the website to function and is used specifically to collect user personal data via analytics, ads, other embedded contents are termed as non-necessary cookies. It is mandatory to procure user consent prior to running these cookies on your website.