Scope 4 emissions: avoided CO2 has value?

Scope 4 CO2 emissions

Scope 4 CO2 emissions reflect the CO2 avoided by an activity. This 11-page note argues the metric warrants more attention. It yields an ‘all of the above’ approach to energy transition, shows where each investment dollar achieves most decarbonization and maximizes the impact of renewables.


Scope 1-3 CO2 emissions are now familiar to most decision-makers. Scope 1 captures the CO2 emitted directly in creating a product. Scope 2 adds the CO2 emitted in generating electricity used to create the product. And Scope 3 adds the CO2 emitted in using the product, for example, by combusting it. A summary is presented by fuel and by material on pages 2-3, with the implication that ‘everything is bad, only some things are less bad than others’.

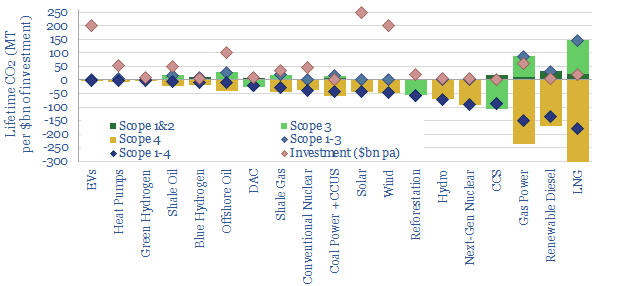
Scope 4 CO2 is intended as an antidote to the depressed conclusion that ‘everything is bad’. It considers the CO2 avoided by an activity. Working from home avoids the CO2 of a commute. Building a wind farm may displace CO2-intensive coal. So too might developing a gas field. Thus the purpose of this note is to construct Scope 1-4 CO2 calculations for 20 different energy technologies, fairly, objectively, and then draw conclusions. The numbers are remarkable (page 4).

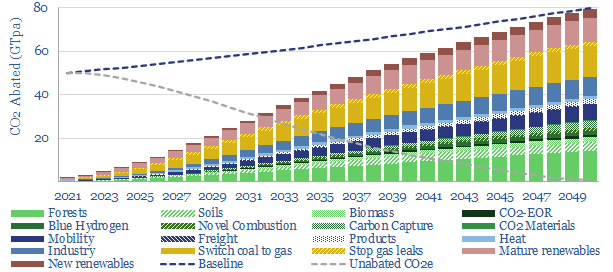
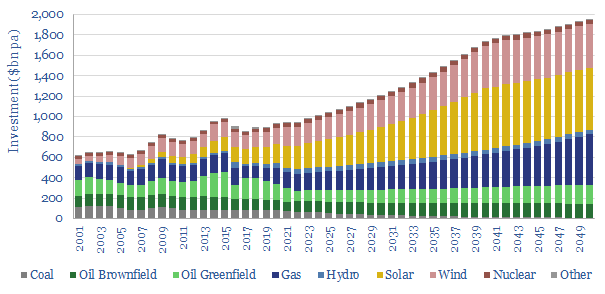
‘All of the above’. Every single option in our chart above has net negative Scope 1-4 CO2 emissions. The more investment that flows in to all of these categories, the faster the world will decarbonize. Our overall roadmap to net zero needs to treble global energy capex to over $3trn pa (pages 4-8).

Project developers and investors should consider Scope 4 CO2. Many categories with deeply negative Scope 1-4 CO2 emissions — sometimes achieving 3x more net CO2 abatement per $1bn of investment than wind, solar and EVs — have been unsuccessful in attractive capital. It may therefore be appealing for project-developers to present Scope 1-4 CO2 benefits on a clear and transparent basis. It may also be appealing for investors to communicate the Scope 1-4 CO2 of their portfolios to their own stakeholders (page 9).

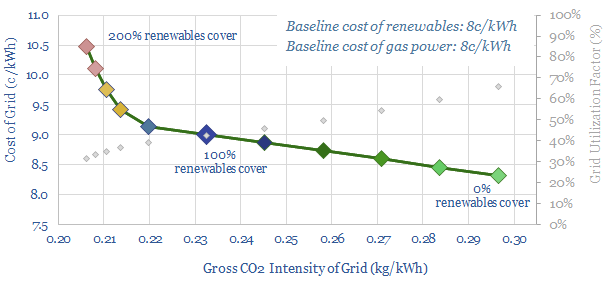
Maximizing decarbonization. Scope 4 CO2 emissions depend on counterfactuals. What is an activity displacing? This matters across the board and can also promote faster decarbonization. For example, a new wind project that displaces nuclear achieves no net decarbonization, whereas an inter-connector that allows that same wind project to displace coal-power avoids 1.2 kg/kWh of CO2 (page 10).

Conceptual limitations of Scope 4 CO2 are discussed on page 11. However, we conclude it is an increasingly important metric for decision makers in the energy transition, to ensure adequate energy supplies are developed, while also decarbonizing as fast as possible.

FACTS of life: upside for STATCOMs & SVCs?

Upside for STATCOMs

Wind and solar have so far leaned upon conventional power grids. But larger deployments will increasingly need to produce their own reactive power; controllably, dynamically. Demand for STATCOMs & SVCs may thus rise 30x, to over $25-50bn pa. This 20-page note outlines upside for STATCOMs and who benefits?


This 20-page research note is about controlling reactive power in increasingly renewable-heavy grids. We believe this theme is going to become increasingly important, but it has been overlooked, for two reasons, laid out on pages 2-3.

What is reactive power? After reviewing hundreds of technical papers and patents, our ‘best explanation’ is set out on pages 4-7, to explain concepts such as real power, reactive power, power factor, power triangles, phase angle and VARs.

Lean on me. Wind and solar assets inherently produce no reactive power and may even have consumed it. This was fine in the early days, as renewables assets could rely on the large and controllable output of reactive power from spinning generators. But regulations are tightening. And if renewables are to dominate future grids, replacing spinning generators, then they will increasingly need to produce their own reactive power (page 8).

FACTS = Flexible AC Transmission Systems. We review different options for renewables to control reactive power on pages 9-14. The discussion covers switched capacitor banks, synchronous condensers, upsized inverters, Static VAR Compensators (SVCs) and Static Synchronous Compensators (STATCOMs). In each case, we review the costs ($/kVAR), advantages and challenges for each technology. We think STATCOMs are taking the lead to back up large wind projects.

Market sizing for STATCOMs and SVCs market suggests that a 30x ramp-up is not mathematically inconceivable. If wind capacity additions ramp from 100 GW pa to 300-500 GW pa, and we install 0.5 MVAR/MW of STATCOMs/SVCs at an average of $160/kVAR, then this would become a $25-50bn pa market. Huge numbers. Worked examples and quotes from technical papers are also given (page 15-16).

Who benefits? Leading companies in STATCOMs and SVCs are profiled on pages 17-20, after reviewing 2,500 patents. The market is incredibly concentrated, with two leading large-caps, and a handful of smaller and interesting semi-pure plays. Our screen is linked here.

To read more about the upside for STATCOMs & SVCs, please see our article here.

Capacitor banks: raising power factors?

Wind and solar power factor corrections

Wind and solar power factor corrections could save 0.5% of global electricity, with $20/ton CO2 abatement costs at typical facilities in normal times, and 30% pure IRRs during energy shortages. They will also be needed to integrate more new energies into power grids. This 17-page note outlines the opportunity in capacitor banks, their economics and leading companies.


Reactive power is needed to create magnetic fields within ‘inductive loads’ like motors, electric heat, IT hardware and LEDs. But it is wasteful. 0.8-0.9 x power factors mean that 10-20% of the flowing current is not doing any useful work; it is simply amplifying I2R resistive losses; and if it is not compensated, then voltage drops can de-stabilize the grid.

All of these statements might seem a little bit confusing. Hence, after reading hundreds of pages into this topic, our ‘best explanation’ of the physics, the problem and the solution are set out on pages 2-6 of the report. We would also recommend the excellent online videos from the Engineering Mindset.

Power factor correction technologies are seen accelerating for three reasons. Saving electricity is increasingly economic amidst energy shortages (pages 7-8).

Second, they will enable greater electrification for around 30% less capex (pages 9-11).

Third, the rise of renewables will see large rotating turbines (especially coal) replaced with distributed generators that inherently offer no reactive power (wind and solar). This is not a “problem”. It simply requires conscious power factor correction (pages 12-14).

What challenges? Capacitor banks are likely to be the lowest cost solution for power factor correction, but they are also competing with other technologies, as reviewed on page 15. For ultra-high quality grid-scale wind and solar power-factor corrections, we think there is greater upside in STATCOMs (note here).

What opportunities? Leading companies are profiled on pages 16-17, based on reviewing patents, and include the usual suspects in power-electronic capital goods.

East to West: re-shoring the energy transition?

re-shoring the energy transition

China is 18% of the world’s people and GDP. But it makes c50% of the world’s metals, 60% of its wind turbines, 70% of its solar panels and 80% of its lithium ion batteries. Re-shoring the energy transition will likely be a growing motivation after events of 2022. This 14-page note explores resultant opportunities.


World events in 2022 have created a new appetite for self-reliance; avoiding excessive dependence upon particular suppliers, in case that relationship should sour in the future. China’s exports are 5x Russia’s. And it dominates supply chains that matter for the energy transition. The trends and market shares are quantified on pages 2-4.

There are five challenges that must be overcome, in order to re-shore value chains from China to the West: input materials, energy costs, 2-3 re-inflation risks, dumping and general Western NIMBY-ism. We outline each challenge on pages 5-6.

Re-shoring the energy transition and its best opportunities are summarized, looking across all of our research, for metals and materials (page 7), wind (page 8), solar (page 9) and batteries (pages 10-11). In each case, where would be the most logical to site the infrastructure, and which companies are involved?

An unexpected implication of re-shoring these value chains is that their underlying energy demand would be re-shored too. Our current base case is that Western energy demand per capita has peaked and Western oil demand is in absolute decline. These markets may be re-shaped, with resultant opportunities for infrastructure investors (pages 12-14).

For an outlook on China’s coal industry and how we compare Chinese coal companies to Western companies, please see our article here.

Glass fiber: what upside in the energy transition?

Glass fiber opportunities

What opportunities for glass fiber in the energy transition? Glass fiber makes up 50% of a wind turbine blade, lightens vehicles and insulates homes for 30-70% energy savings. Hence we see demand rising 3.5x in the energy transition. To appraise the opportunity, this 13-page note assesses the market, costs, CO2 intensity and leading companies.


6% of the global glass market is sold in the form of fibers, a mesh of 4-40μm thick filaments. They can be used directly as an insulation material, or woven into a fabric and embedded in a polymer resin matrix, yielding ‘fiberglass’. These production processes are summarized on pages 2-3.

Applications in the energy transition are then quantified on pages 4-7, including for wind turbine blades, insulation of homes, light-weighting vehicles and substituting for higher-cost and higher-carbon alternative materials. This underpins our forecast for 3.75x market growth.

The energy economics of producing glass fiber are modelled on pages 8-10, in order to quantify the marginal cost, cost breakdown, energy intensity and CO2 emissions of glass fiber product.

The biggest challenge for the industry is industrial leakage, as we find that some product made in the emerging world can undercut the West by c50% on price, despite having 2x higher CO2 intensity (page 11).

The company landscape is summarized on pages 12-13. There are four main listed companies (2 in China, 2 in the West). Interestingly, private equity firms have recently been buying up European pure-plays.

Renewables: can they ramp up faster?

Bottlenecks on renewable capacity

How fast can wind and solar accelerate, especially if energy shortages persist? This 11-page note reviews the top ten bottlenecks that set the ‘upper limit’ on renewables’ capacity additions. Seven value chains will tighten enormously in the coming years. Paradoxically, however, ramping renewables could exacerbate near-term energy shortages.


Our growing fear for 2022 is that a full-blown energy crisis may be brewing. The most ‘obvious’ solution is going to be to accelerate renewables. Hence this note models out a hypothetical scenario where the world tried to scale up renewables about 5x faster, adding 1TW pa of new wind and solar capacity each year (page 2).

Capex is the first bottleneck, as our scenario would require almost $2trn of spending on wind and solar, which is 3x total global energy investment from the past half-decade. This is a lot of capital, but not a show-stopper in our assessment (page 3).

Materials are more challenging, and we map out the total demand pull on global steel, copper, silicon, fiberglass and carbon fiber; and we also discuss the CO2 and energy intensity of each of these materials in turn (pages 4-7).

Specialized supply chains tighten most. We identify three specific industries which would effectively see unlimited pricing power in our scenario (pages 7-8).

Energy paybacks present the biggest paradox. It takes 2-years for the average wind and solar asset to repay the energy costs of manufacturing and installing it. Hence in the near-term, a very rapid ramp-up of renewables would tend to exacerbate energy shortages (page 9).

Land and labor are often cited as bottlenecks on ramping up renewables, but we do not think these are material barriers, by contrast to the others (pages 10-11).

Our conclusion is that appetite to scale renewables will rise sharply in 2022. It will
not resolve near-term energy shortages. But inflation will accelerate in ‘bottlenecked’
parts of the supply chain. Investors can help by debottlenecking those bottlenecks.

Decarbonizing global energy: the route to net zero?

Decarbonizing global energy

This 18-page report revises our roadmap for the world to reach ‘net zero’ by 2050. The average cost is still $40/ton of CO2, with an upper bound of $120/ton, but this masks material mix-shifts. New opportunities are largest in efficiency gains, under-supplied commodities, power-electronics, conventional CCUS and nature-based CO2 removals.

Important note: our latest roadmap to net zero is from 2022, published here. But this note remains on our website, for transparency into our views at the end of 2021.


This note looks back across 750 of our research publications from 2019-21 and updates our most practical, lowest cost roadmap for the world to reach ‘net zero’. Our framework for decarbonizing 80GTpa of potential emissions in 2050 is outlined on pages 2-3.

Our updated roadmap is presented on pages 4-6. Most striking is the mix-shift. New technologies have been added at the bottom of the cost curve. Other crucial components have re-inflated. And we have also been able to tighten the ‘risking factors’ on earlier-stage technologies, thus an amazing 87% of our roadmap is not technically ready.

The resulting energy mix and costs for the global economy are spelled out on pages 7-8, including changes to our long-term forecasts for oil, gas, renewables and nuclear.

What has changed from our 2020 roadmap? A full attribution is given on pages 9-10. Disappointingly, global emissions will be 2GTpa higher than we had hoped mid-decade, as gas shortages perpetuate the use of coal.

A more detailed review of our roadmap is presented on pages 11-18. We focus on summarizing the key changes in our outlook in 2021, in a simple 1-2 page format: looking across renewables, nuclear, gas shortages, inflationary feedback loops, more efficiency gains, carbon capture and storage and nature-based carbon removals.

Is the world investing enough in energy?

Global energy investment in 2020-21

Global energy investment in 2020-21 has been running 10% below the level needed on our roadmap to net zero. Under-investment is steepest for solar, wind and gas. Under-appreciated is that each $1 dis-invested from fossil fuels must be replaced with $25 in renewables, to add the same new energy supplies. Future energy capex requirements are staggering. These are the conclusion in our 14-page note.


This 14-page note compares annual energy investment in different upstream energy sources with the amounts that would be required on our roadmap to net zero. The methodology is explained on page 2.

Current investment levels in each energy source are described on pages 3-5, reviewing the trajectory for each major category: oil, gas, coal, wind and solar. A stark contrast is found in capex per MWH of new added energy supplies.

We have constructed 120 different models, in order to stress-test the capex costs per MWH of new added energy supplies, across different resource types. Conclusions and comparisons from our modelling are presented on pages 6-8.

How much would the world need to be investing, on our roadmap to net zero, or indeed on the IEA’s roadmap to net zero? We develop our numbers, category by category, on pages 9-12, to identify where the gaps are greatest.

Conclusions and controversies are laid out on pages 13-14. Disinvestment from oil and gas will tend to exacerbate future energy shortages. To avoid this, it would be ideal to replace each dis-invested $1 of oil and gas investment with around $25 of new renewables investment.

Integrated energy: a new model?

building blocks for a zero-carbon energy

This 14-page note lays out a new model to supply fully carbon-neutral energy to a cluster of commercial and industrial consumers, via an integrated package of renewables, low-carbon gas back-ups and nature based carbon removals. This is remarkable for three reasons: low cost, high stability, and full technical readiness. The prize may be very large.


Four building blocks for a zero-carbon energy mix are outlined on pages 2-5. They include wind, solar, gas-fired CHPs and gas-fired CCGTs. Costs, CO2 intensities and key debates are reviewed for each technology.

Taking out the CO2 requires high-quality nature based carbon removals, for any truly ‘carbon neutral’ energy mix. Meeting this challenge is described on pages 5-7. There will be nay-sayers who do not like this model. To them, we ask, why do you hate nature so much?

Finding a fit requires combining the different building blocks above into an integrated energy system. We find the optimal fit is for renewables capacity to cover 110% of average grid demand. The balancing act is outlined on pages 8-10.

The gas supply chain that backs up the renewables must minimize methane leaks and use the gas as efficiently as possible. Our suggestions are laid out on pages 11-12.

The commercial benefits of this integrated model are described on pages 13-14. We think this is an excellent opportunity to provide fully carbon-neutral energy, using fully mature technologies, at costs well below 10c/kWh and highly bankable price-stability.

Offshore wind: will costs follow Moore’s Law?

How is the power of a wind turbine calculated?

Some commentators expect the levelized costs of offshore wind to fall another two-thirds by 2050. The justification is some eolian equivalent of Moore’s Law. Our 16-page report draws five contrasts. Wind costs are most likely to move sideways, even as the industry builds larger turbines. Implications are explored for companies.


Deflating wind costs are explored on pages 2-3. Deflation is important. But consensus forecasts could be dangerously wrong in our opinion.

Our report lays out five reasons why wind looks different to Moore’s Law, which has doubled computing performance every 18-months since 1965.

(1) Offshore wind costs are not following Moore’s Law yet. And after reviewing 50 patents from one of the world’s leading wind developers, we think the industry’s largest focus is not on costs (pages 4-5)

(2) Making turbines ever-larger is “the opposite” of making transistors ever-smaller. We review the physics and a simple issue around extrapolation (pages 5-6)

(3) Larger turbines face larger challenges. Unlike Moore’s Law, physics “work against” the up-scaling of wind turbines (pages 7-9).

(4) Larger turbines are more carbon intensive, using advanced materials that are 10-25x more costly and CO2-emitting, paradoxically requiring more fossil fuels. This looks like “the opposite” of the bootstrapping that helped propel Moore’s Law (pages 10-13)

(5) Wind turbines crowd out wind turbines, as grids ultimately become saturated with highly inter-correlated wind generation. This re-inflates marginal costs. Again, this is the opposite of bootstrapping (pages 14-15).

Our conclusions for companies are drawn out on page 16.

Copyright: Thunder Said Energy, 2019-2024.