Can solar reach 45% of a power grid? This has been the biggest pushback on our recent report, scoring solar potential by country, where we argued the best regions globally – California, Australia – could reach 45% solar by 2050. Hence today’s model explores what a 45% solar grid might look like. Generation is 53% solar. 8% is curtailed, 35% is used directly, 7% is used via demand-shifting and 3% is time-shifted via batteries.
Solar can easily reach 30% of a 100MW power grid, as shown in the chart below. Specifically, to calculate this curve, we took the actual distribution of power demand in California, and the actual distribution of solar insolation as calculated from first principles. As both of these variables vary seasonally, we calculated balances for each month separately, then averaged together all twelve months of the year.
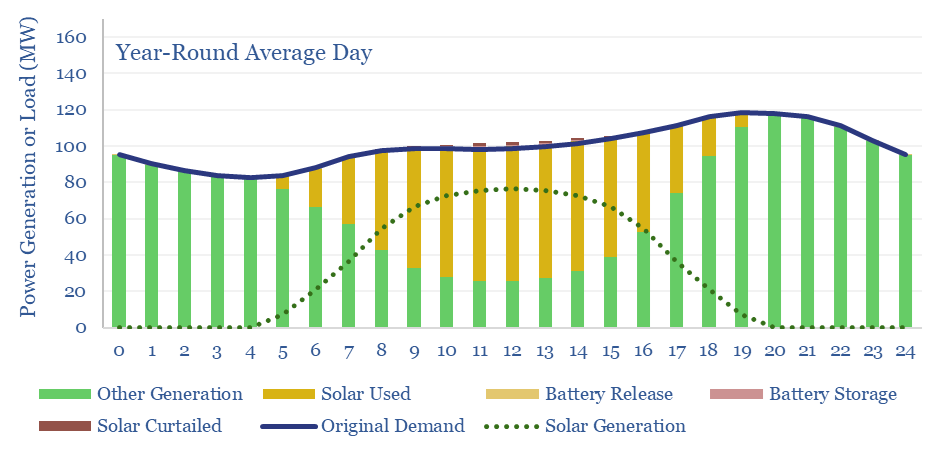
Can solar reach higher shares of the grid? We are going to set a limit that 25% of baseload generation (i.e., non-solar generation) can never be curtailed, as it is needed for grid stability, both instantaneously (e.g., due to inertia) and intra-day, to ramp up if/when solar stops generating. Hence ramping up solar beyond 30% of a grid requires some adaptations.
Can solar reach 45% shares of a grid? We think the answer to this question is yes, and the chart below shows our best attempt to model what such a grid would look like. It uses three adaptations.
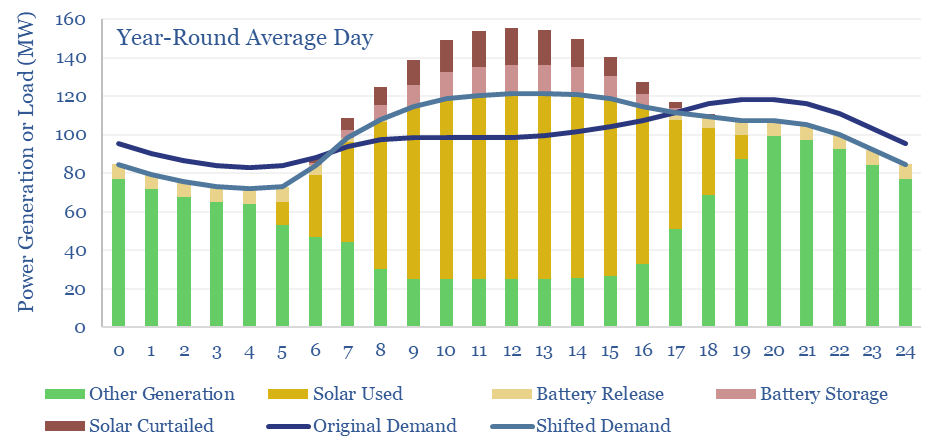
Curtailments are not the end of the world. If 15% of the solar that is generated fails to dispatch, then this requires the ‘other 85%’ to charge about 15% more, in order to achieve the same IRRs. In other words, the LCOPE of all solar in our grid re-inflates from 6-7c/kWh to 7-8c/kWh. This is mildly inflationary, but basically fine. But a challenge for deploying further solar from here, is that a c15% average curtailment rate is associated with a c50% marginal curtailment rate, so building incremental solar from here will likely cost 12-15c/kWh (see below).
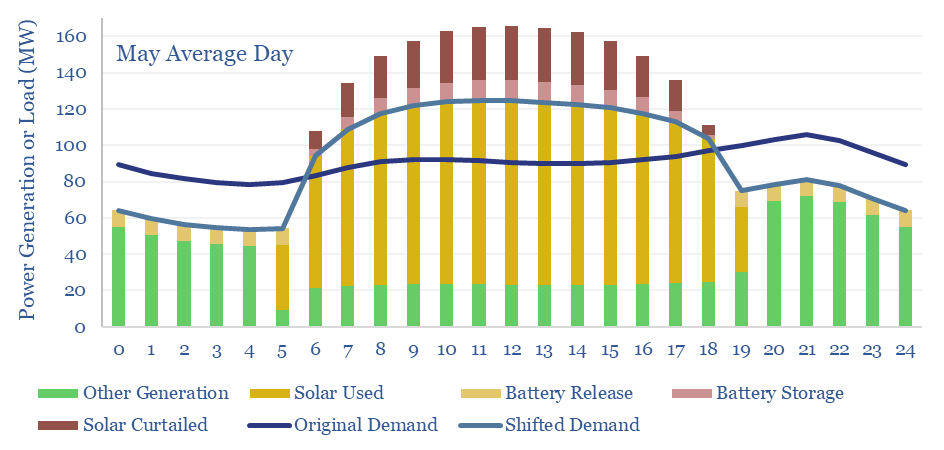
Demand shifting is the second adaptation that allows solar to reach higher shares. It is generally cheaper to move parts of the original demand curve (dark blue line) to when the solar is generating (yielding the light blue line), than to store solar energy in a battery and re-release it when solar is not generating. Our model has the total demand curve shifted by +/- 8% on average throughout the year. The need for demand shifting is highest in May, at +/- 15%. And highest at midday in May, when 34MW of excess demand must be absorbed, in our 100MW grid.
EV charging helps to contextualize our demand-shifting numbers. A typical EV has a 70kWh battery, and might charge at 10kW for 7-hours. Hence absorbing c34MW of excess demand in our 100MW grid is going to require 3,400 EVs, or 34EVs per MW of average load. For comparison, our EV sales forecasts show the US reaching 35M EVs on the road by 2030, which would equate to 70 EVs per MW of average US load. As long as about half of the US’s EVs are plugged into a solar-energized charger, there is no problem absorbing this excess demand.
Battery storage is the third adaptation that allows solar to reach higher shares of a power grid. In our scenario above, supplying 45% of the electricity in a 100MW grid with solar, requires building 200MW of solar and 30MW of batteries. The batteries absorb and re-release 6% of the solar generation, and end up providing 3.5% of the total grid. This varies from 2% in December (the month of lowest solar insolation) to 5% in May (the month with the largest excess of solar to absorb or curtail, charts below).
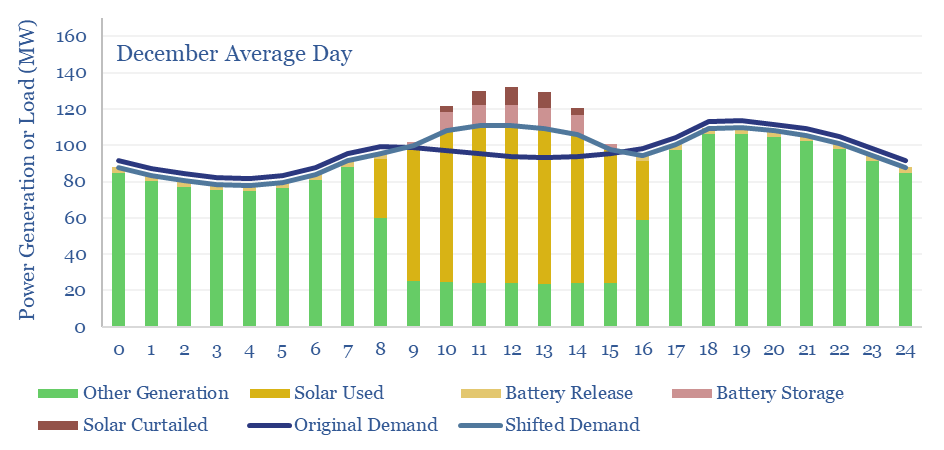
The reason we think grids will lean less on batteries is the cost of batteries. Each MW of batteries charges and discharges 240 times per year, which implies a storage spread of 30c/kWh. Across 3% of the total grid, this raises total grid costs by 1c/kWh.
Possible but inflationary? Overall, it is possible for solar to reach 45% of a power grid, along the lines outlined above. But an additional 3-5c/kWh is added in transmission and distribution costs (due to falling grid utilization), +1c/kWh in curtailment costs, +1c/kWh in battery costs, and 55% of the grid must still come from other sources, where infrastructure must still be maintained and included in rate bases. Renewables may add 4-6c/kWh to end consumer costs, in absolute terms, but remain a low-cost way to halve the CO2 intensity of power grids, while achieving other environmental and geopolitical goals.
It is not unrealistic for solar to reach 45% of the grid, in countries that are particularly well-placed for solar, as per our note below.
The model linked below is a nice tool for stress-testing different options around the ultimate share of solar in grids, and the need to lean on curtailment, demand-shifting and batteries. You can vary the installed base of solar, the share of non-solar baseload that cannot be curtailed, percent of excess solar that is demand-shifted, excess solar that is stored, and see the resulting power grid distribution, hour-by-hour, month-by-month.