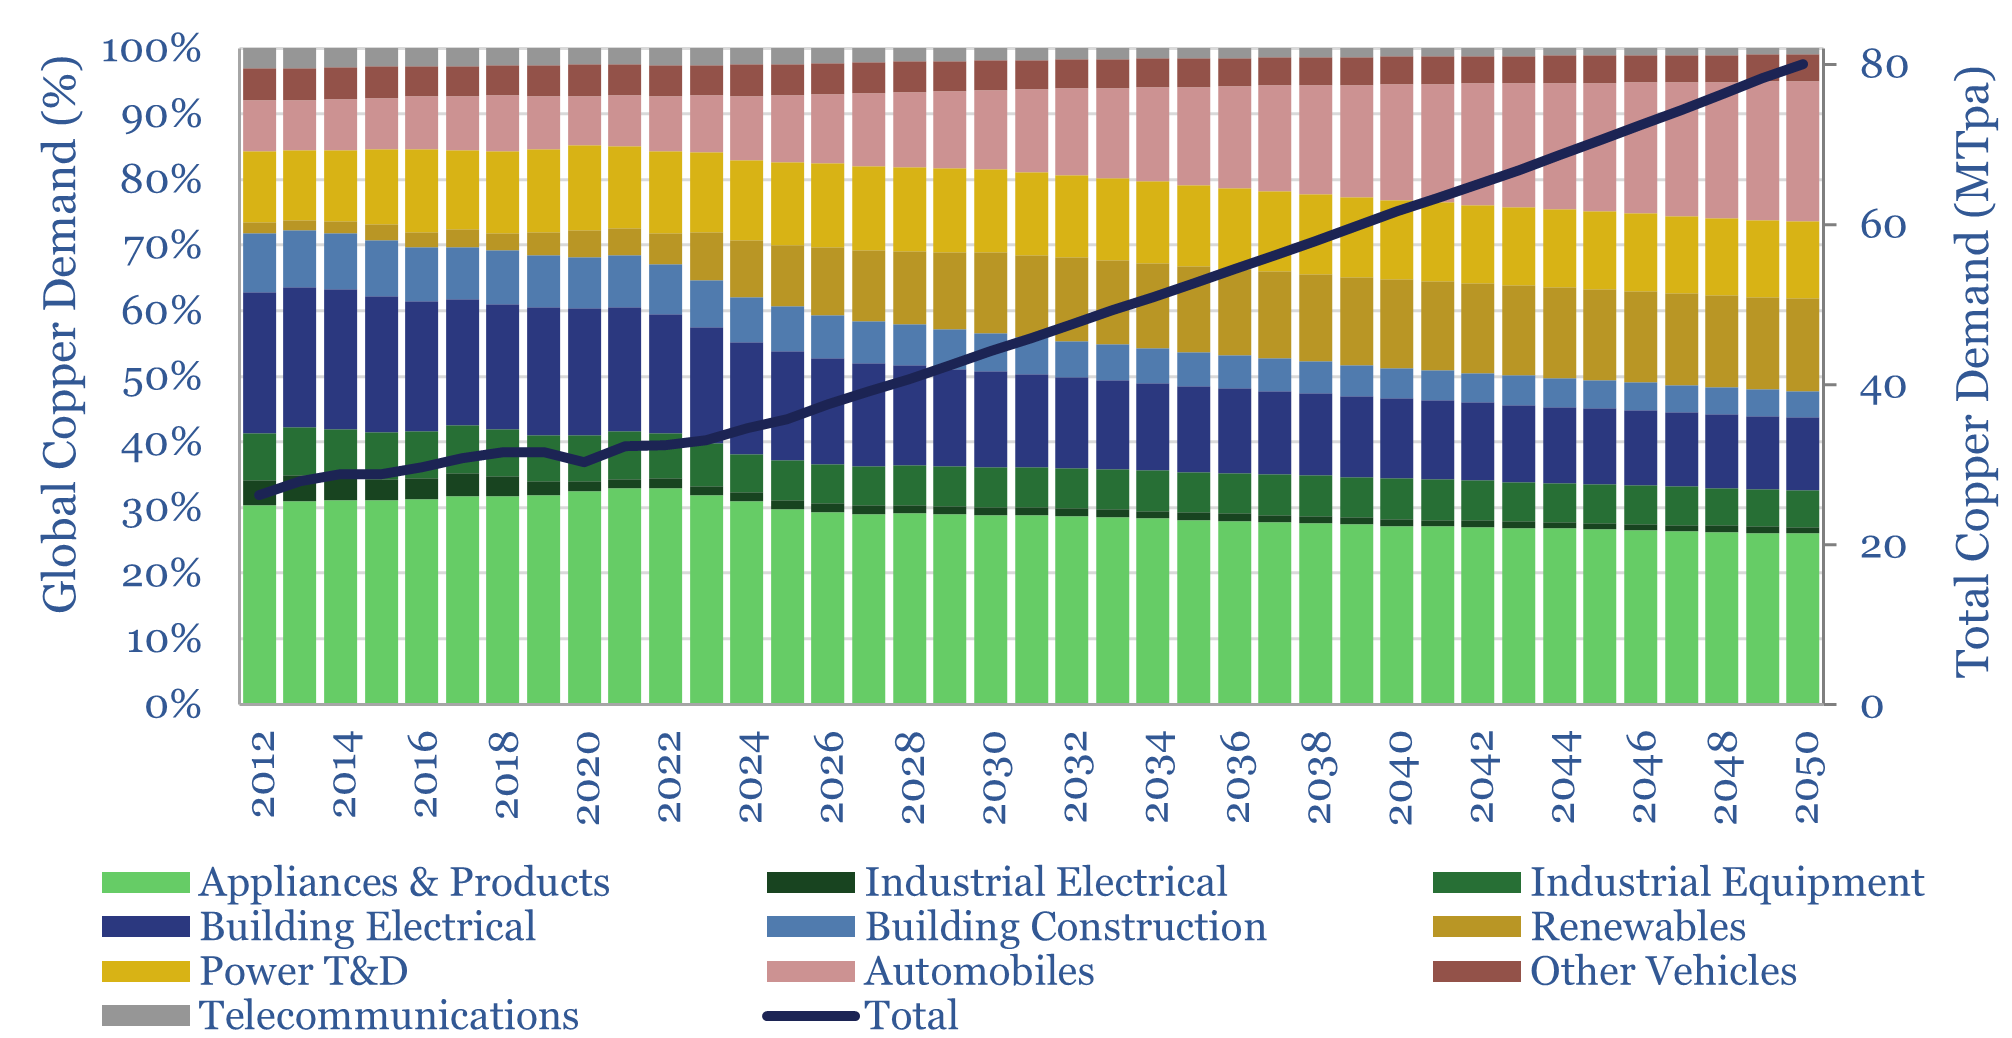
This data-file estimates global copper demand as part of the energy transition, rising from 34.5MTpa in 2024 to 44MTpa in 2030 and 80MTpa by 2050. Key demand drivers are solar, EVs, greater AC adoption and possibly drones and robotics. You can stress test half-a-dozen key input variables in the model.
This data-file estimates the growth in global copper demand in the energy transition. Global copper demand stood at 34.5MTpa in 2024, and will most likely increase to 80MTpa by 2050, in our base case scenario.
Future global copper demand is sensitive to GDP. But we also want to break down the sensitivity to solar, EVs, greater AC adoption and possibly drones and robotics.
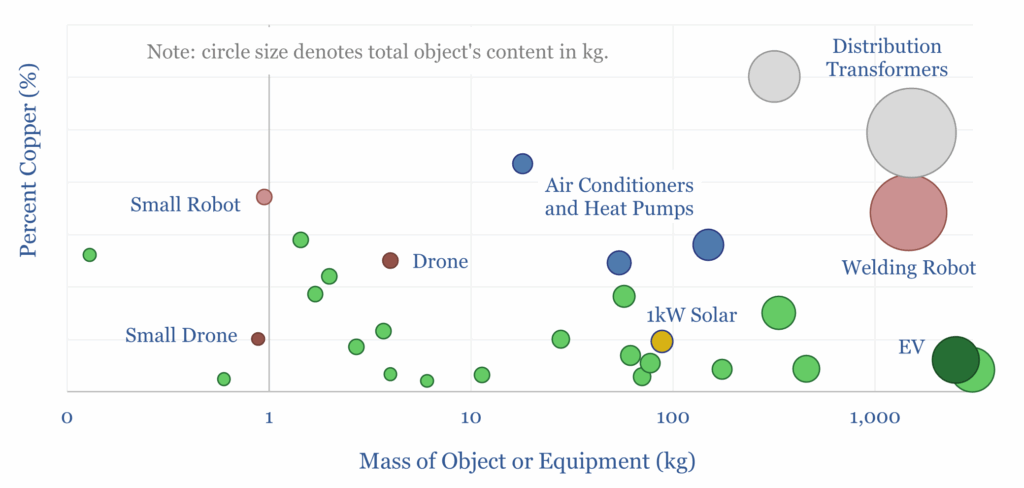
In order to reach these numbers, we have tabulated the typical copper content of capital goods and consumer goods (charted below). All electronics contain a small percentage of copper, while motors, cables and transformers are particularly copper intensive.
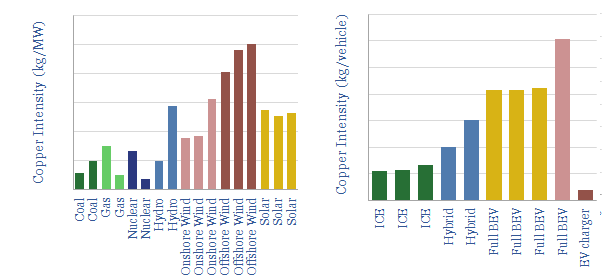
Copper demand intensity factors. Copper use in wind, copper use in solar, copper use in electric vehicles and copper use in power grids — transmission and distribution — are also substantiated with industry data-points in the file.
The global copper market today comprises 33% consumer devices, 32% electrical power distribution in grids and buildings, 14% for transportation equipment, 12% for electrical capital goods, 7% for other uses in buildings, 3% for telecommunications, according to data from the Copper Council.
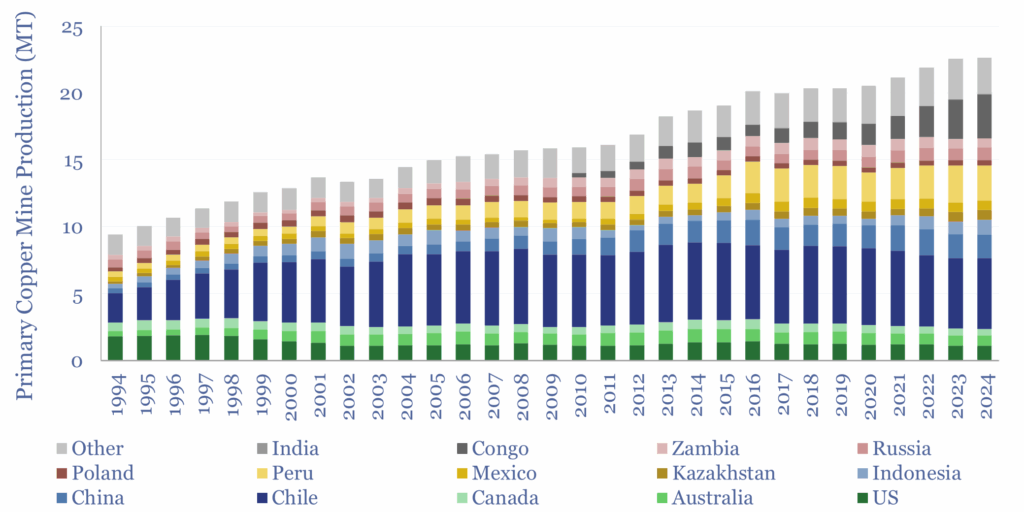
Global copper production is also disaggregated in the data-file, on a mined basis (chart below), and on a refined basis, using data from the USGS. For production costs, please see our economic model of copper production and copper company screen.
The data-file allows you to stress test different scenarios, varying the ultimate share of electric vehicles in the vehicle fleet, the rise of long-distance power transmission, global GDP growth, the rise of robotics, reductions in copper intensity, and the ultimate share of renewables in the grid. This is part of our broader research into metals and materials demand in the energy transition.
Units and definitions. Note that our demand numbers are measured on a gross weight basis, and count both copper and copper-containing alloys. Other market breakdowns come in closer to 27MTpa for 2023-24, on a refined copper basis, which excludes non-copper metals in copper-containing alloys. Our other copper research is linked here.