This data-file is a screen of the world’s largest copper companies, across c15 miners and producers that produce half of the global market, averaging 0.85MTpa each, deriving 30% of their EBITDA from copper, at 40% EBITDA margins, with a reserve life of 29-years. Summary details are given for each copper company in the data-file.
We have tabulated 15 copper companies’ size, type, headcount, patent count, production, reserves, RP ratio, relative exposure, key assets and other notes in this data-file.
These 15 leading companies produce half of the world’s copper, and generated $40bn of copper EBITDA in 2023, at an average margin of 38%. But do the data in our screen point to tightening markets?
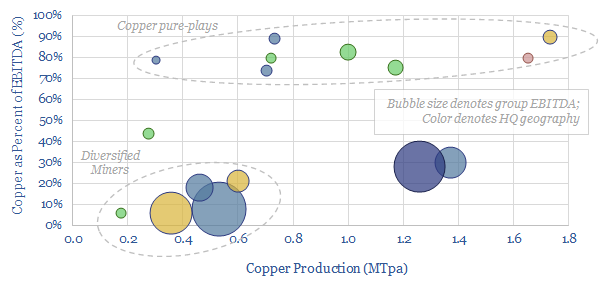
The average company produces around 0.8MTpa of copper, has a 30 year reserve life, and derives 30% of its EBITDA from copper.
Global copper demand rises from 30MTpa in 2023 to 42MTpa by 2030, due to electrification, solar, EVs and the rise of AI.
However RP ratios for the ten largest companies in the peer group have decreased from 28 years in 2013-14 to 27.5 years in 2023, even as global average copper prices rose 20% to $8.5/kg (below).
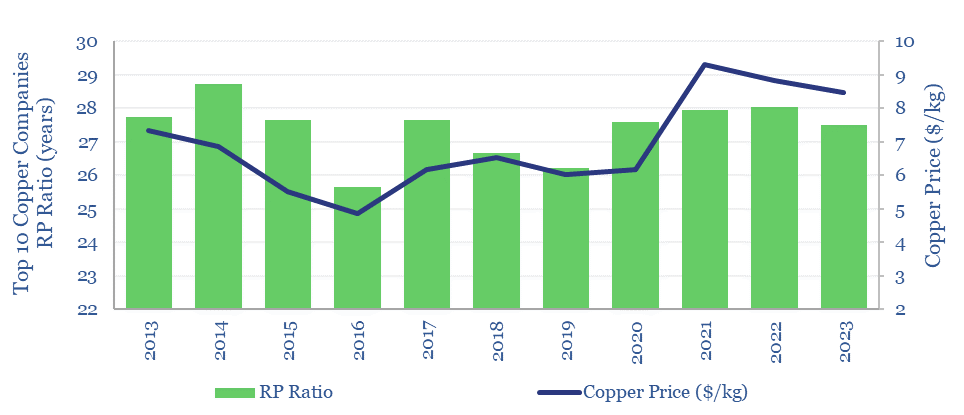
Average production costs across the group also increased by c20%, from $3.5/kg in 2013 to $4.1/kg in 2023. Labor productivity was more lumpy. Further cost details are available in our economic model of copper production.
15 companies are covered overall in our screen of copper producers, including diversified miners such as Glencore, BHP, Rio Tinto and Anglo American; and more concentrated specialists such as Codelco, Freeport McMoRan, Southern Copper, Antofagasta. Generally, the data do seem to imply that a copper capex cycle is gearing up.