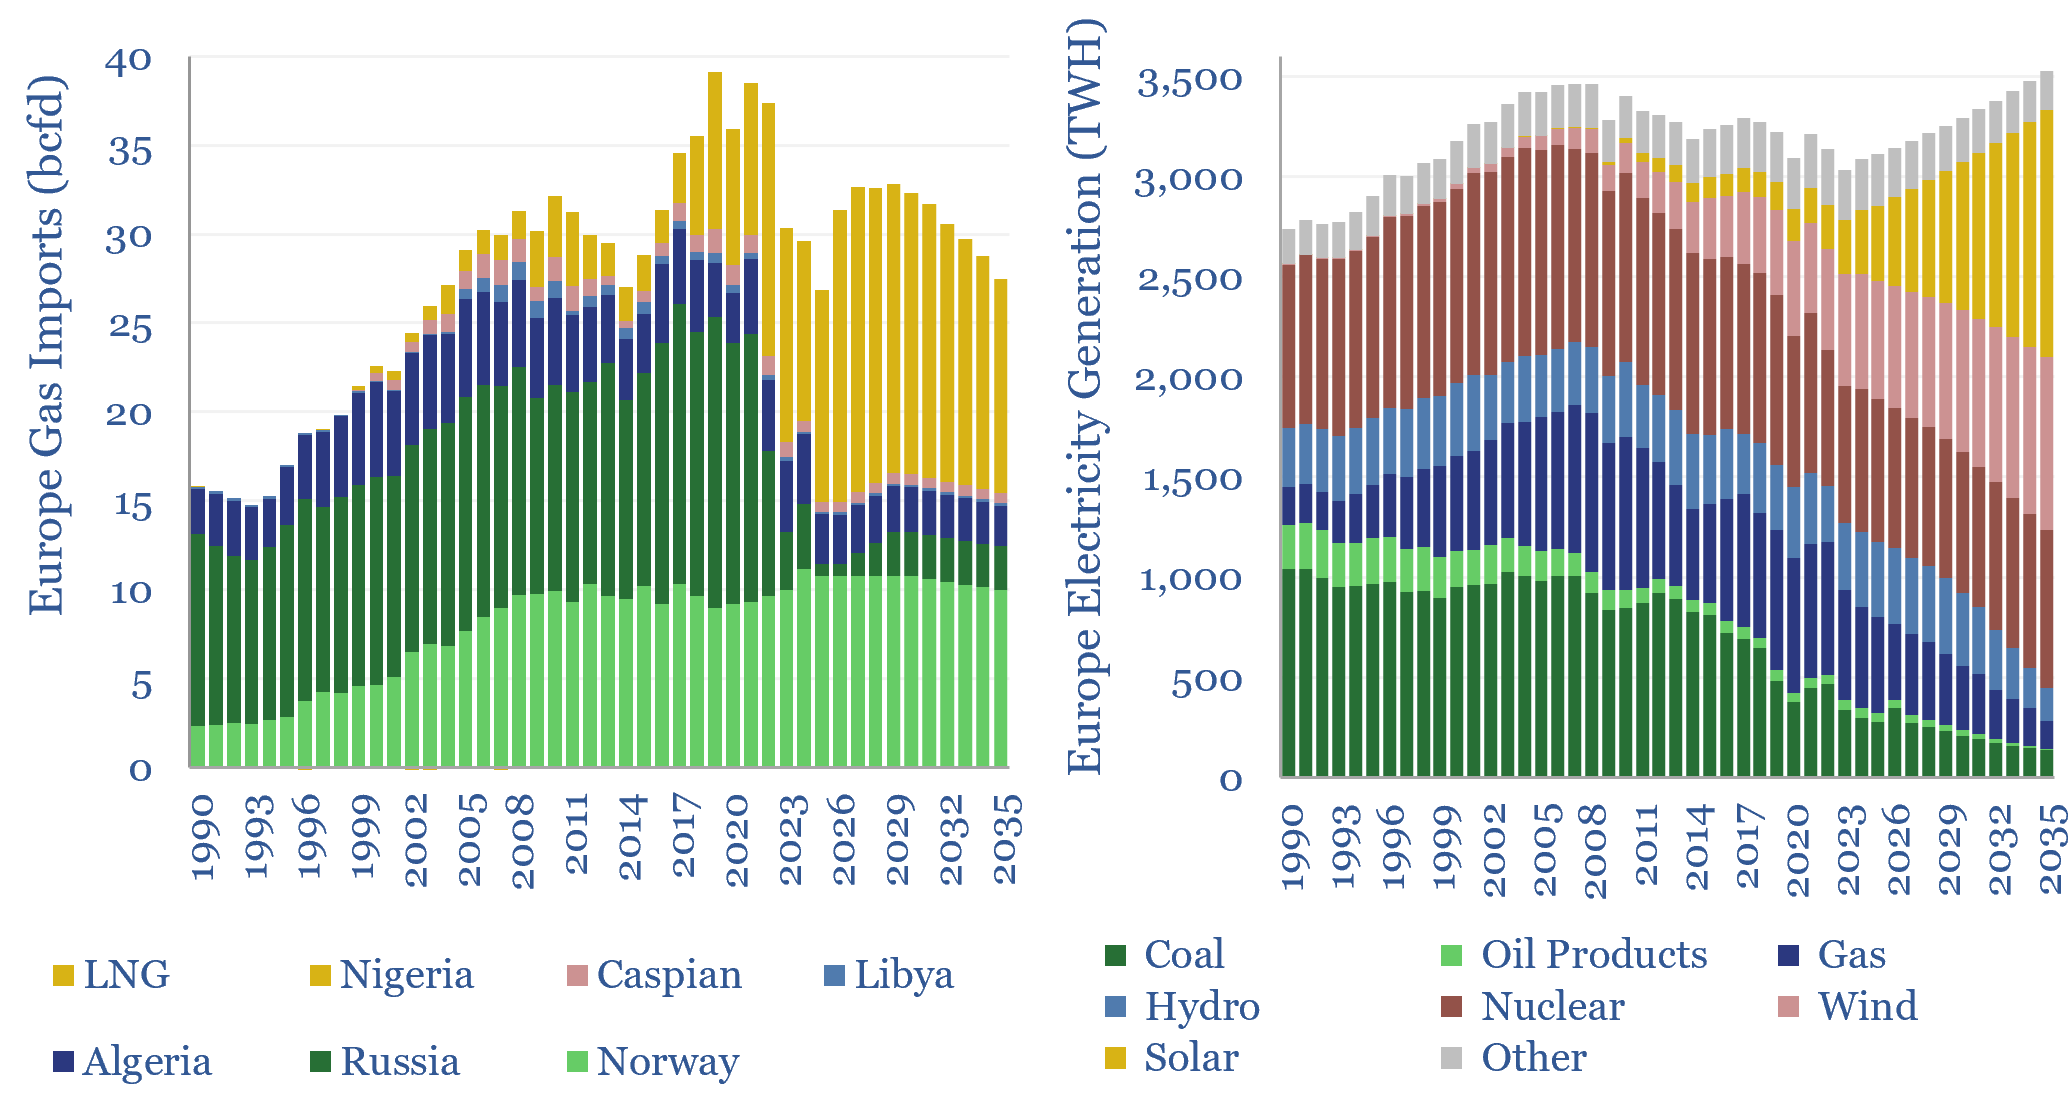
This data-file is our European gas supply-demand model. Balances are assessed in European gas and power markets from 1990 to 2035, reflecting all of our research into Europe’s energy transition. 2024-25 gas markets were supported by inventory draw-downs, but LNG imports step up from 110MTpa to 120MTpa through 2030, before softening again through 2035.
Europe’s gas demand averaged 45bcfd in the decade from 2012 to 2021, of which c30% was consumed in industry, c30% in residential heating, c10% in commercial heating, c25% in electricity generation, and smaller quantities in T&D and transportation (chart below). Gas demand is disaggregated across a dozen different industries in the data-file.
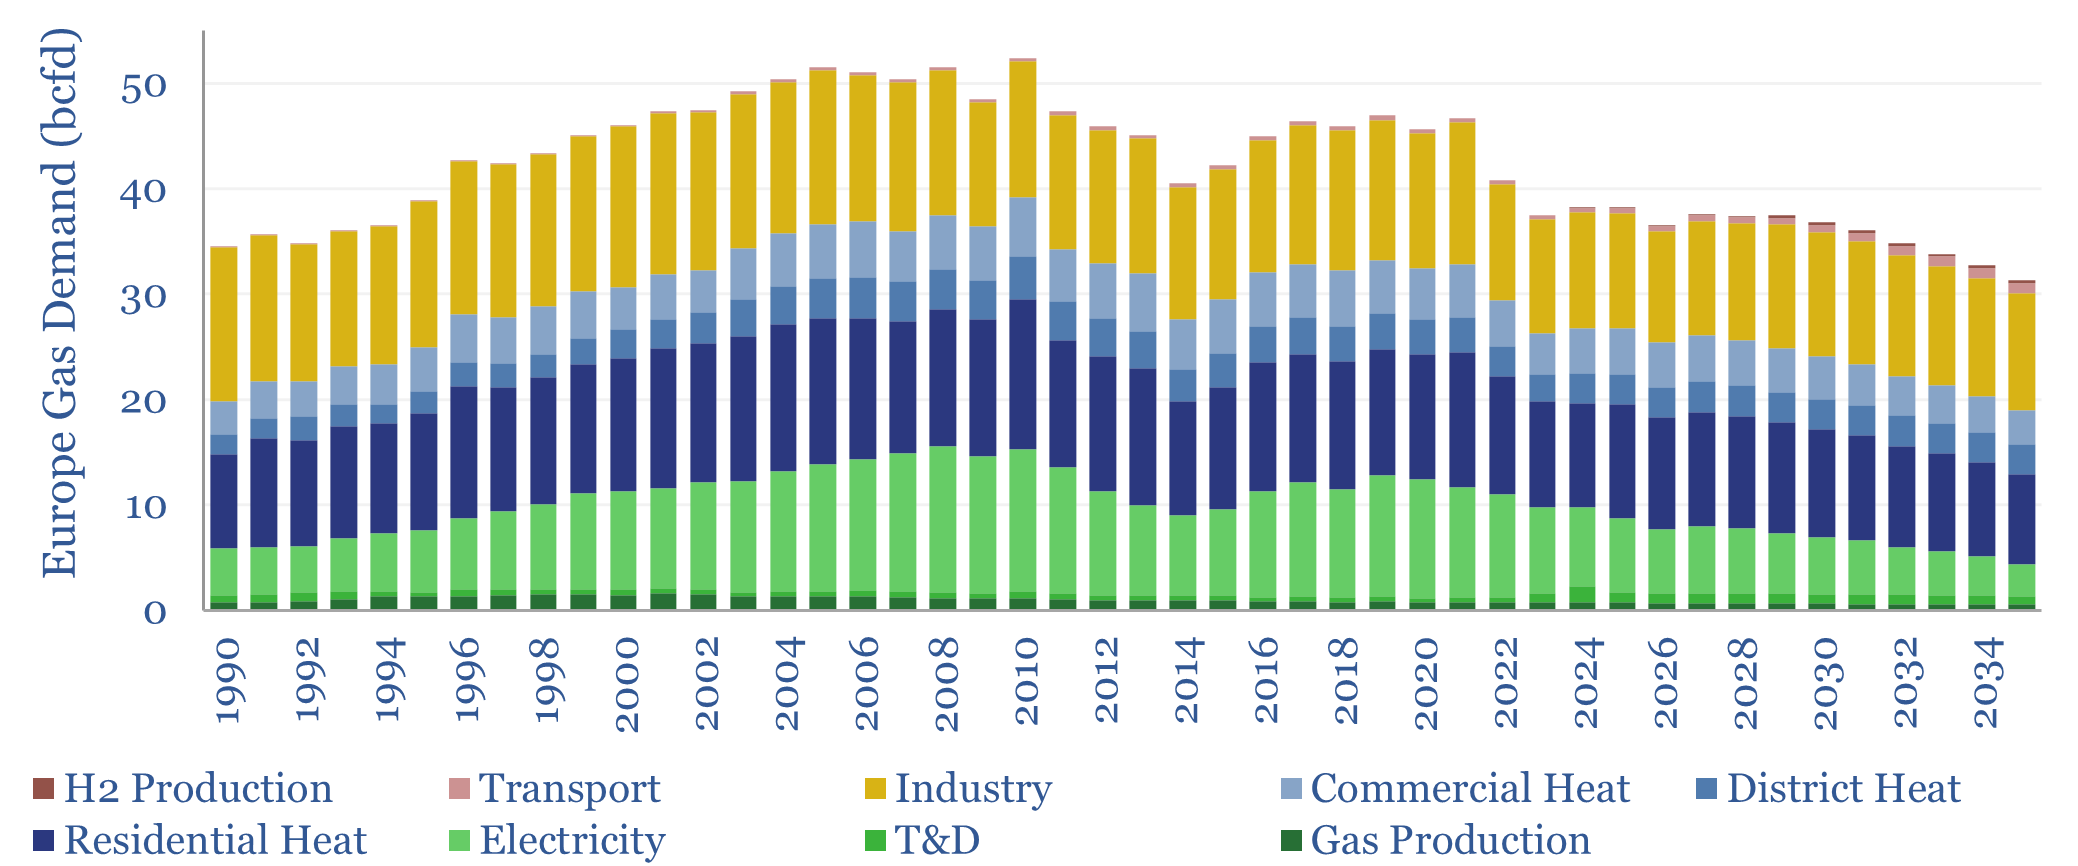
Detailed European natural gas demand data for 2024 were finally released in January-2026, running at 335bcm, up just +0.4% from 2023, which in turn was the lowest since 1995.
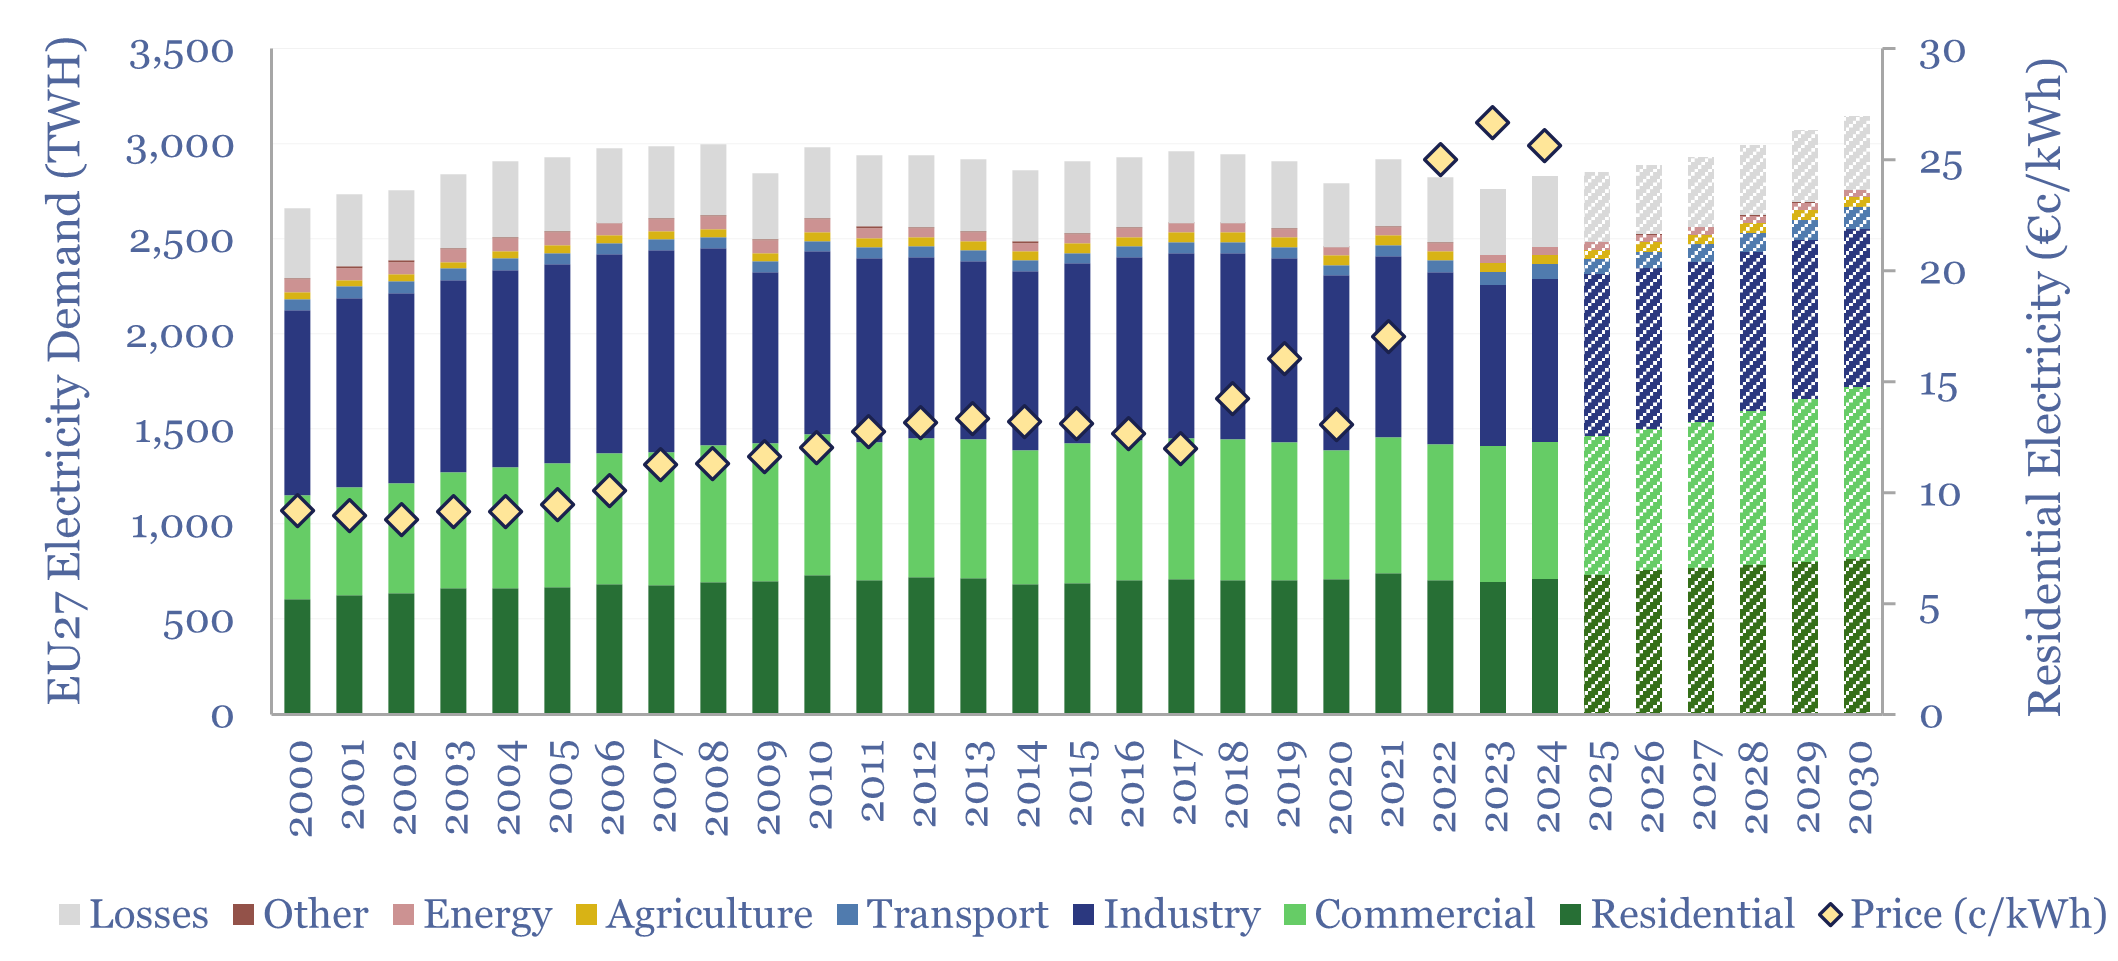
Gas use for power generation did rise by +1% to 94bcm in 2024, but this still lagged the +2.4% YoY growth in overall European electricity demand (which in turn was driven by residential demand from the electrification of heat, data centers, food, and charging more electric vehicles).
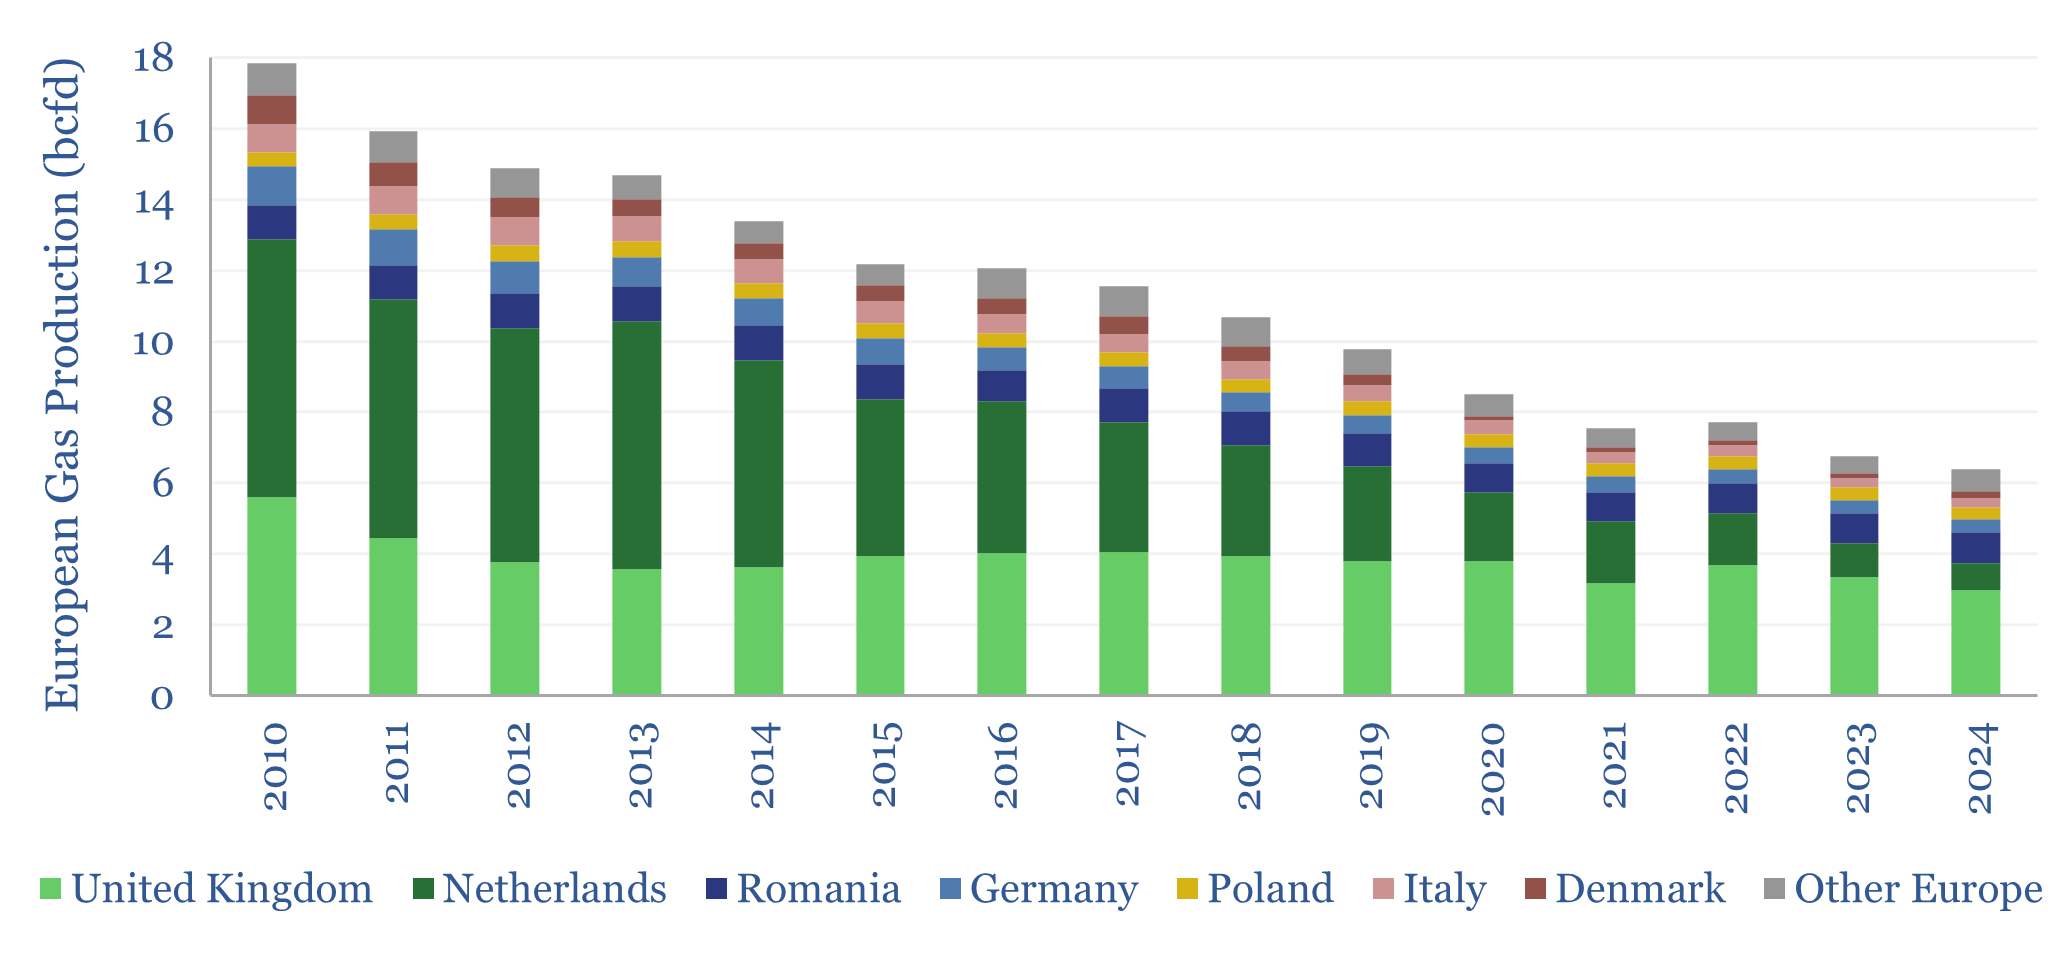
Europe’s indigenous gas supply looks increasingly pathetic. We likely fell below 7bcfd of domestic gas production in 2023, down from a peak of 24bcfd, 20-years ago. Even amidst the supply disruptions of 2022, there is no sign yet that Europe is seriously considering long-term supply growth. Although there is vast potential in European shale.
Europe has doubled its reliance on imports over the past 20-30 years, rising from a 40-45% share of final demand in 1990-2004, to an 80-85% share in 2021-25. Thank god for Norway, which is also the cleanest and lowest carbon gas in the world.
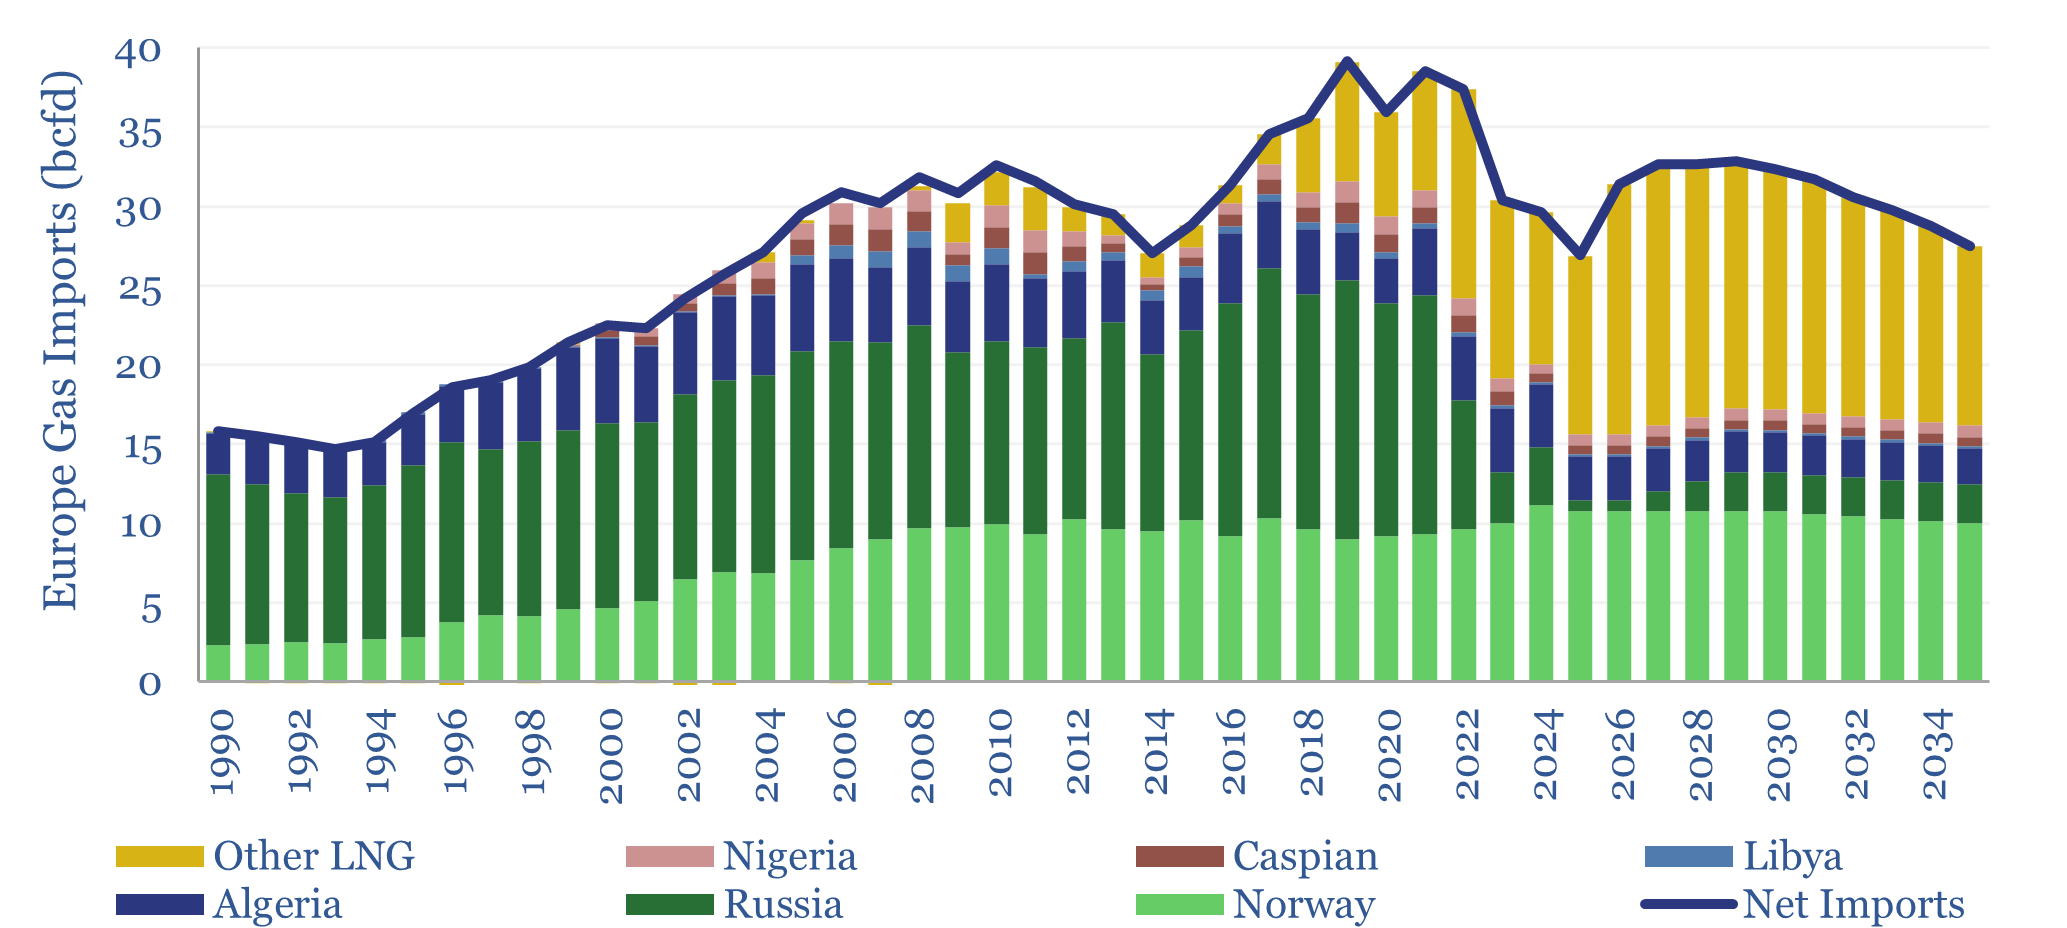
Recently, Russian supplies have collapsed, while our outlook sees a large pull on global LNG through 2030. We think this will support LNG prices.
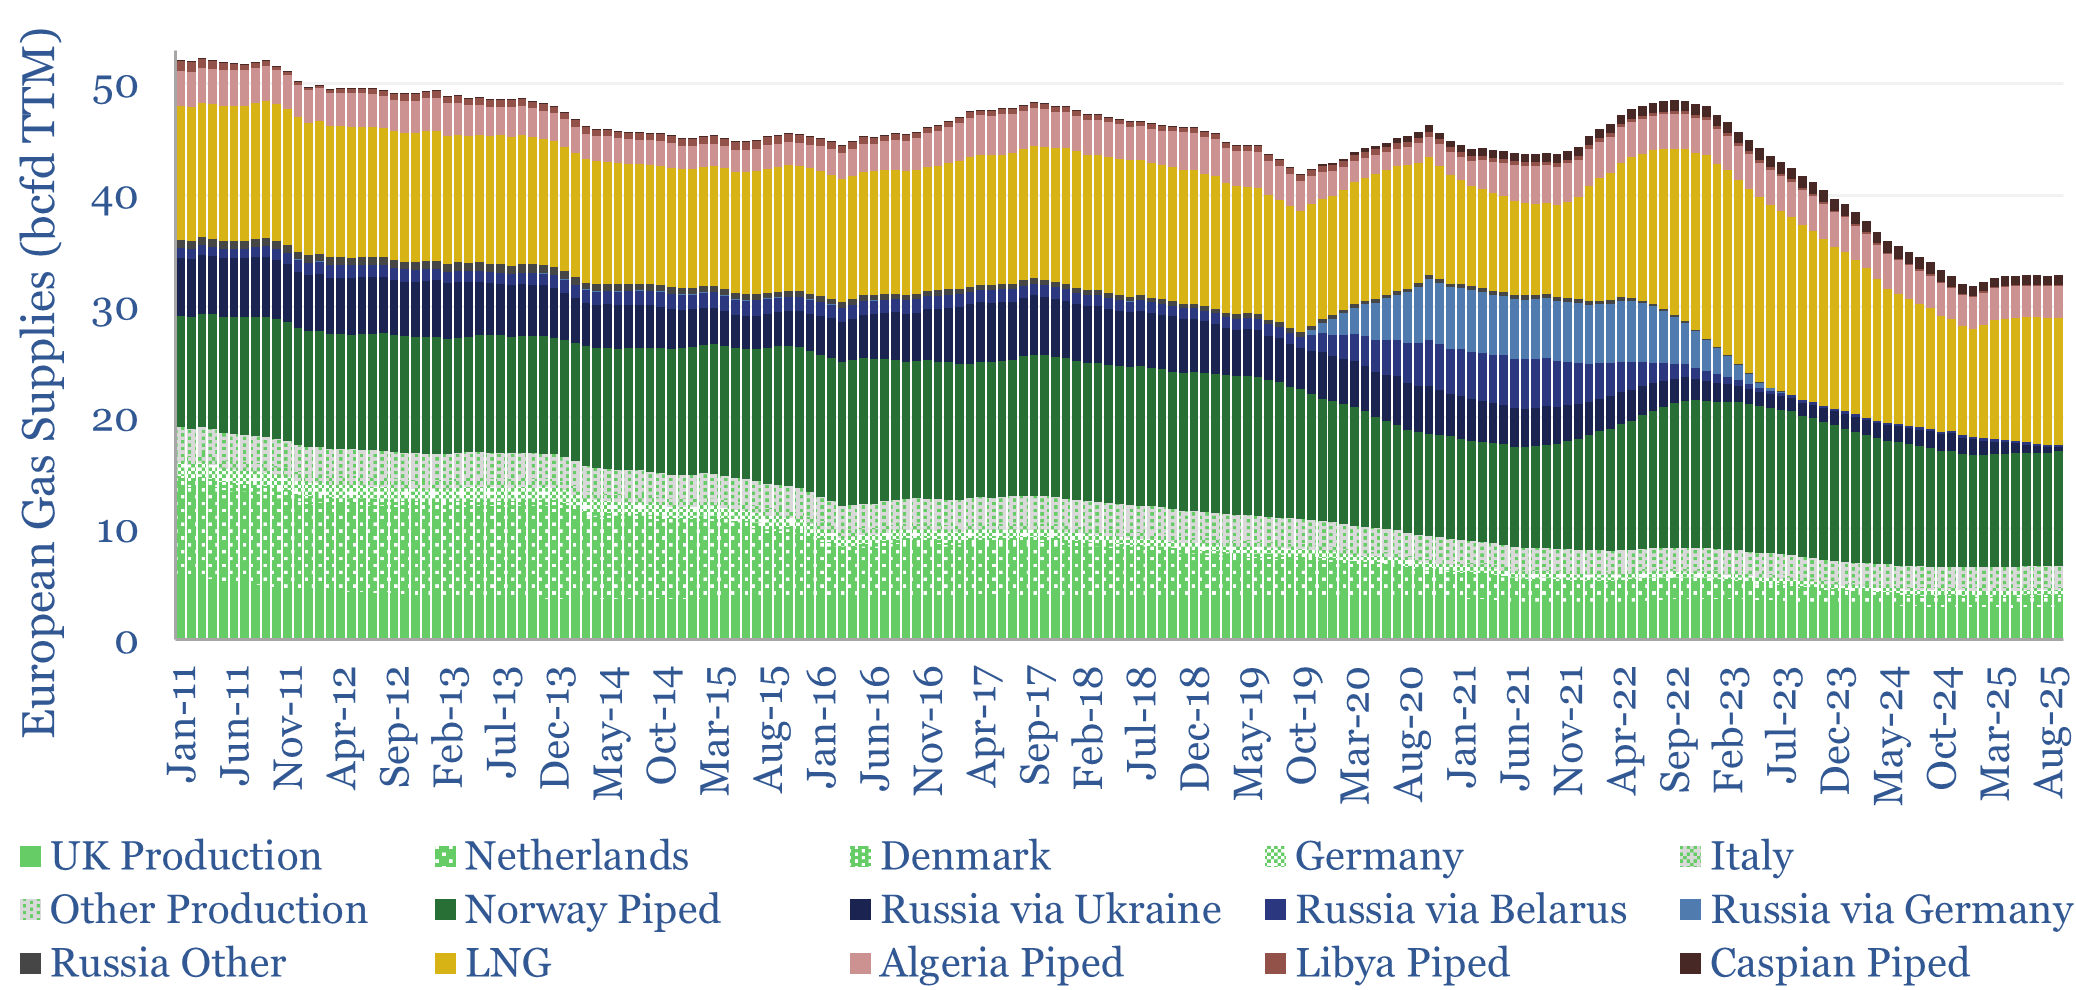
The data file also contains granular data, decomposing gas demand across 8 major categories, plus 13 industrial segments, going back to 1990 (albeit some of the latest data-points are lagged); as well as 15 different supply sources, with monthly data going back a decade (chart below).
All models are wrong, but some models are useful. Hence variables that can be flexed in the model, for stress-testing purposes, include the growth rates of renewables (wind and solar), the rise of electric vehicles, the rise of heat pumps, the phase-out of coal and nuclear, industrial activity, efficiency gains, LNG and hydrogen. Please download the model to run your own scenarios.