Global commodity demand is levered to GDP. Specifically, for each +/- 1% acceleration or deceleration in global GDP, commodity demand tends to accelerate or decelerate by +/- 1.4%, with a 70% R-squared, across 25 examples that are indexed in this data-file. Oil demand sensitivity to GDP is particularly interesting.
This data-file starts by gathering real GDP growth data from the IMF, back to 1960, globally, in the US, Europe and China. We can then run multi-variate regressions, showing how YoY demand for individual commodities relates to real GDP growth.
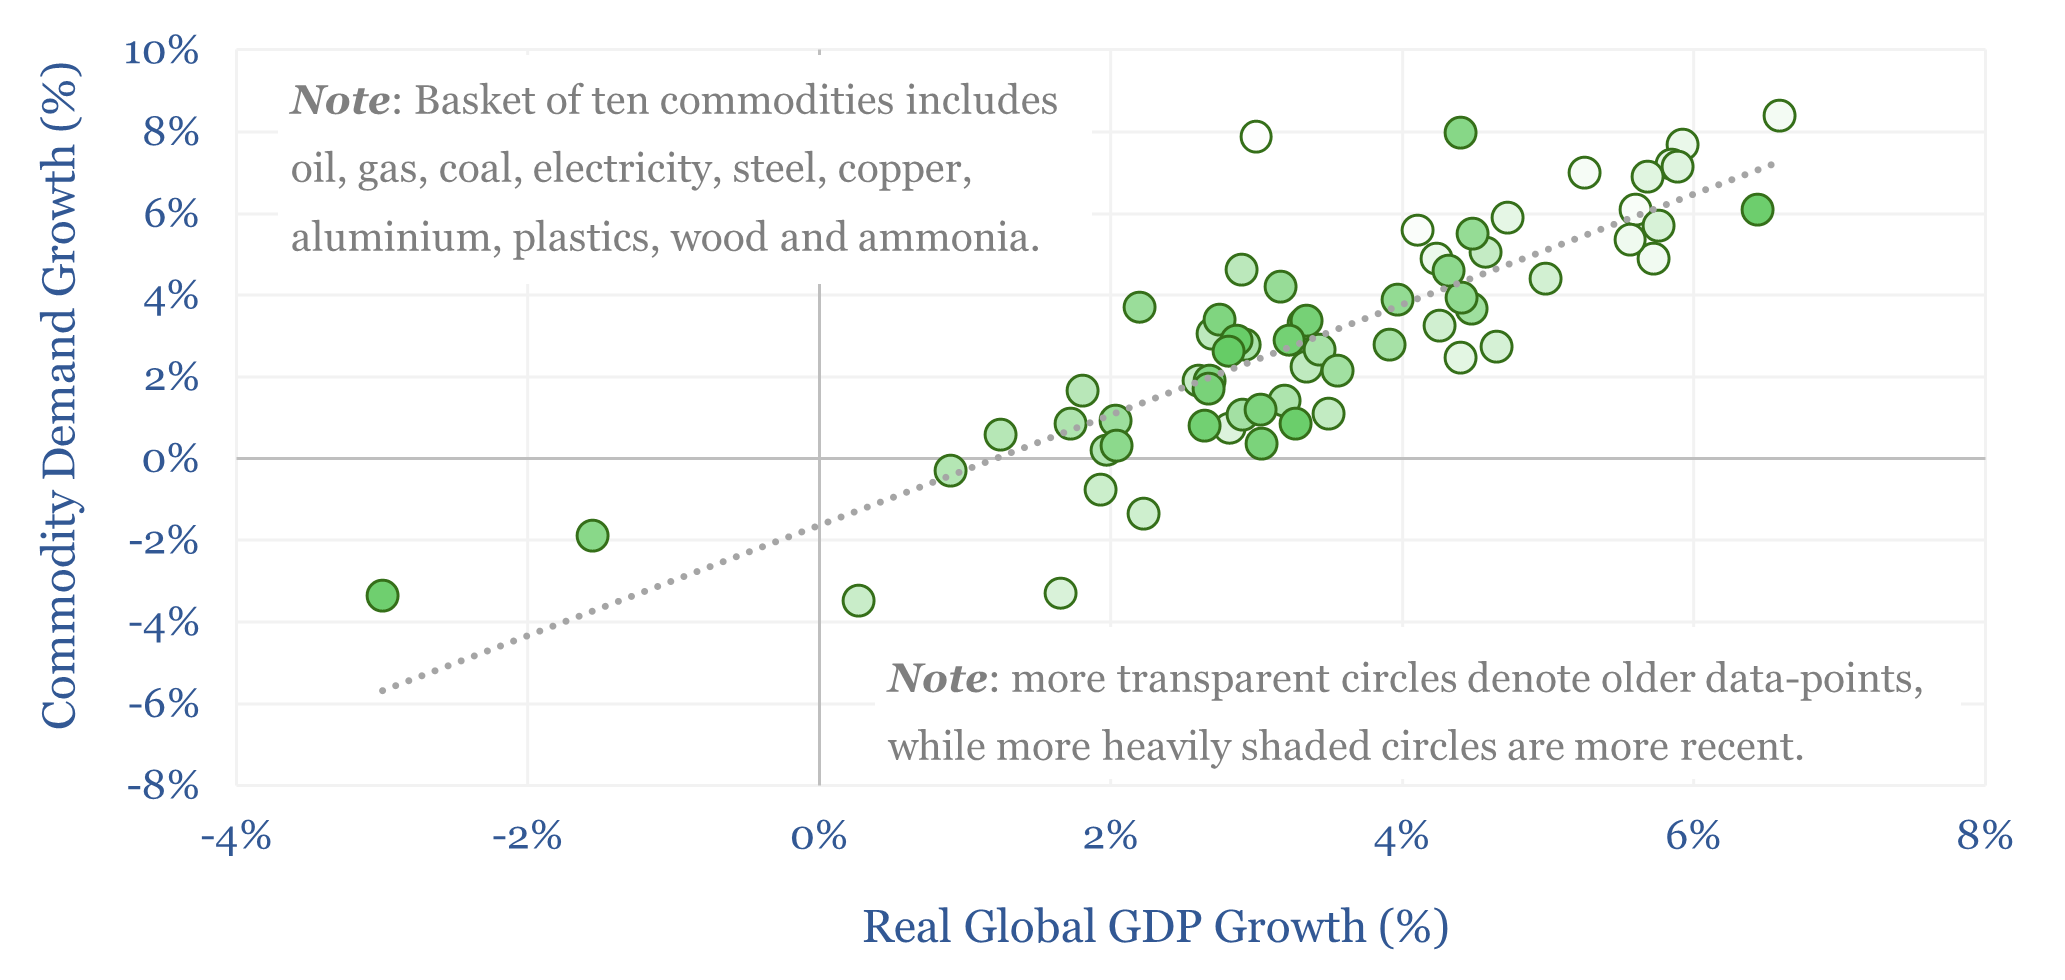
Commodities covered in the data-file include oil, gasoline, jet fuel, diesel, fuel oil, coal, gas, electricity, steel, plastics, wood, copper, aluminium, ammonia, and sub-divisions of these commodities in geographies such as the US, Europe and China.
Across all of the charts in the data-file, lighter dots denote data-points from further back in time. Fully white dots go all the way back to 1960. And more heavily shaded circles are more recent, with fully colored dots representing 2024 data.
Oil makes for a good example. GDP growth explains 67% of the variance in global oil demand (chart below). Over the prior 65-years, each 1% variation in global GDP growth is statistically associated with a 0.5-2% variation in global oil demand, depending on the timeframe considered, with an average beta of 1.7% over the entire period.

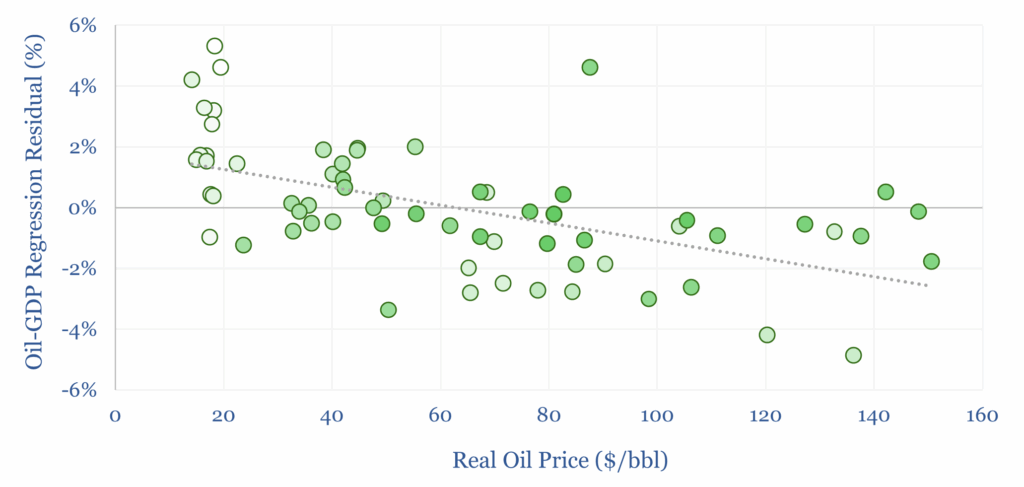
Another one-third of the variance in the oil demand series is explained by oil prices. In other words, if we take the “residuals” from the oil-GDP regression relationship above, it is 33% correlated with real oil prices, allowing us to quantify oil price elasticity of demand. So together, these two variables explain 80% of the YoY variance in oil demand.
Other interesting charts in the data-file cover the relationship between underlying oil products and GDP, between metals demand and GDP, between regional gas demand and regional GDP and between China’s metals demand and Chinese GDP.
Global commodity demand sensitivity to GDP. If we index all of the commodities together, according to their contribution to $6trn pa of global commodity trade, then YoY demand for this overall basket of commodities is 85% correlated with GDP growth, for a 70% R-squared and a 1.4x beta. I.e., a +1% acceleration in GDP would tend to unlock +1.4% additional demand for commodities in general.