The costs of oil refining are captured in this data-file, requiring a crack spread above $20/bbl to generate a 10% IRR on a new, greenfield oil refinery in the developed world, with $35M/kbpd in capex costs. Crack spreads have run at $11/bbl in the past decade, hence capacity utilization is tightening.
A complex Western oil refinery distills crude oil into its various fractions, then cracks and upgrades these fractions, to maximize the yields of high-quality gasoline, diesel and jet fuel.
Typical refinery yields are plotted below based on data from the US EIA. Note that upgrading heavy fractions into light fractions results in a ‘refinery gain’. Mass is preserved. But density falls. Hence product volume is higher than input volume.

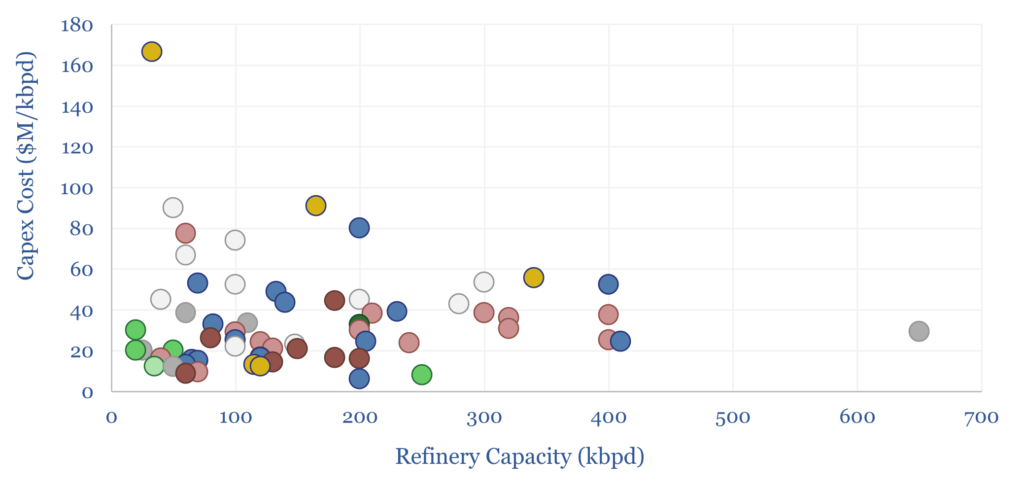
The capex costs of greenfield refineries are tabulated from past refinery projects and tend to average $30-35M/kbpd of refining capacity (chart below). Depreciating these capex costs over c30-years contributes c$4/bbl to refining costs.
The energy costs of refining are equivalent to around 10% of the energy embedded in the crude oil being refined. This is why oil products have a low EROEI.
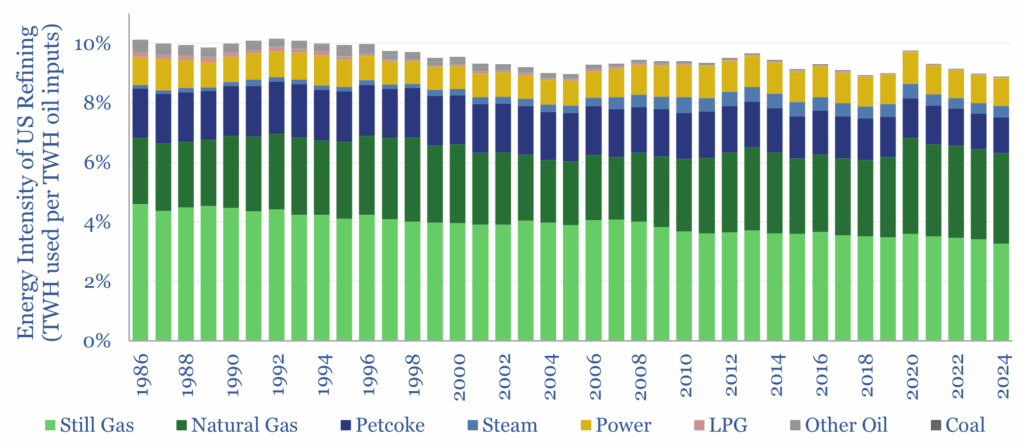
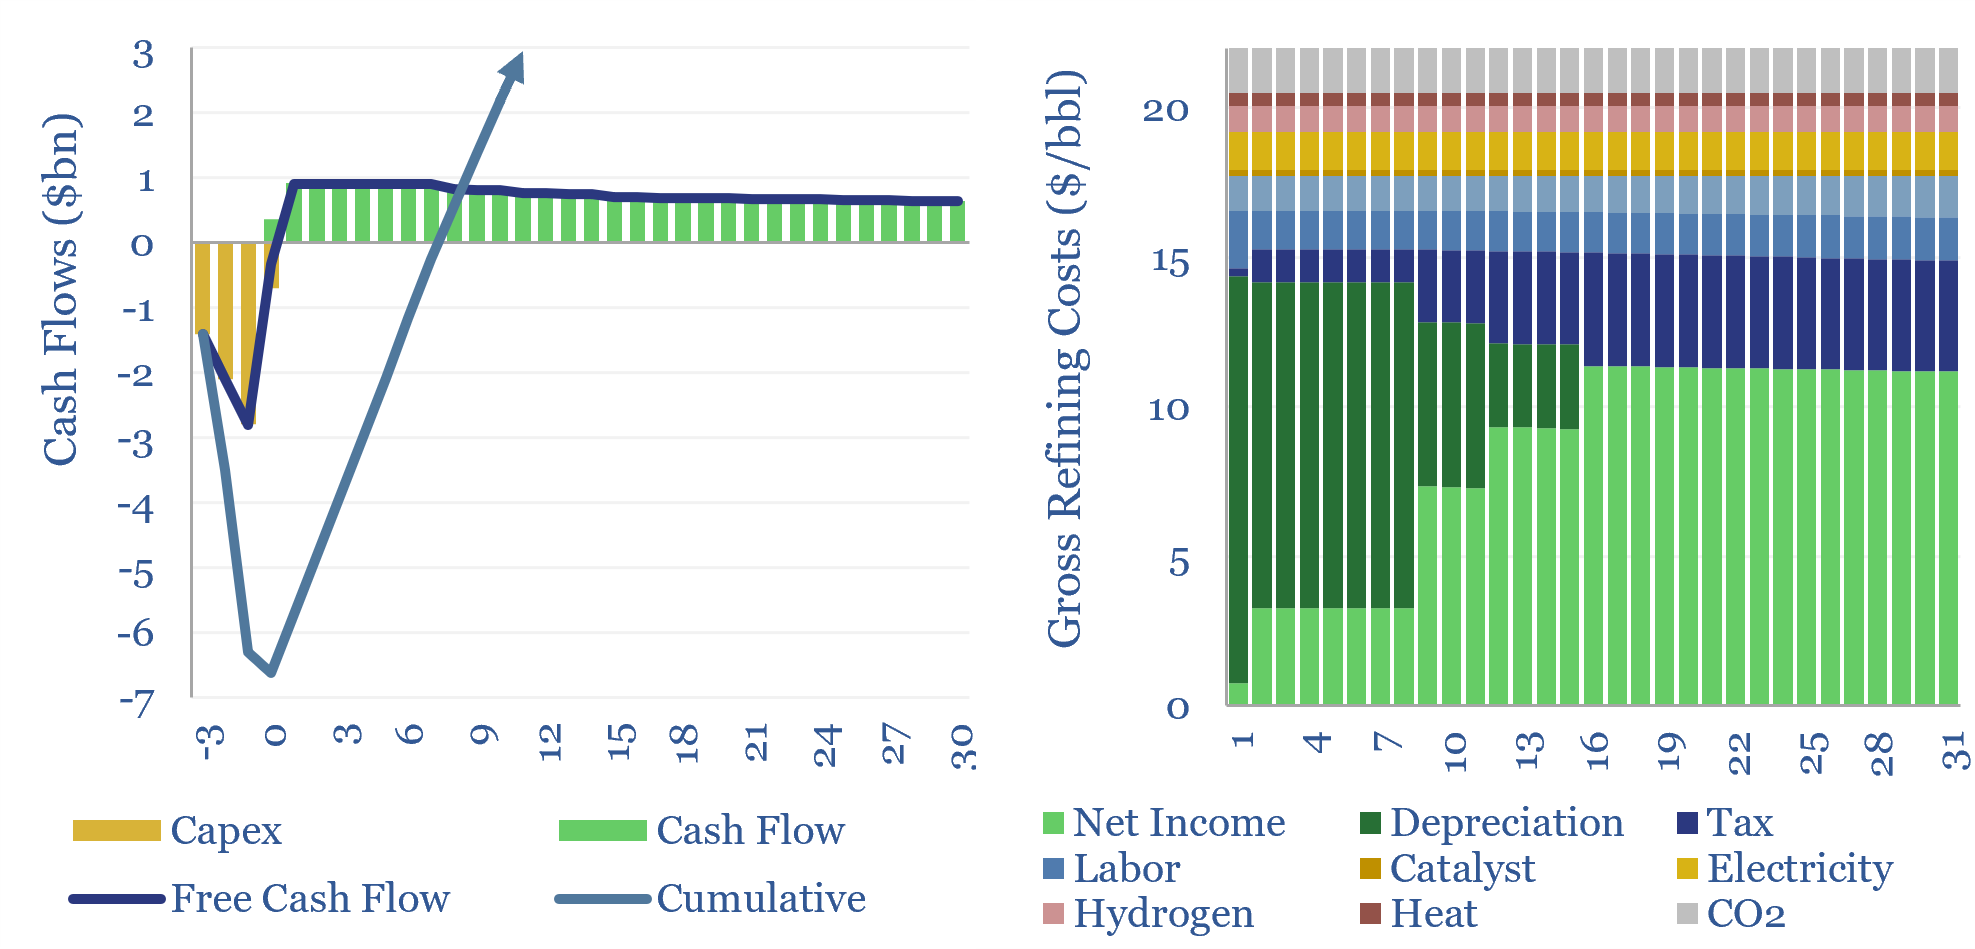
This model captures refineries’ energy costs in detail, including self-generated hydrogen from methane reforming, merchant hydrogen, the combustion of still gas for heat, the combustion of gas for heat, and electricity consumption from pumps, motors and to power process equipment. Numbers chime with the reported Scope1 emissions that are self-reported by US refiners. Energy costs of refining can be stress-tested in the data-file.
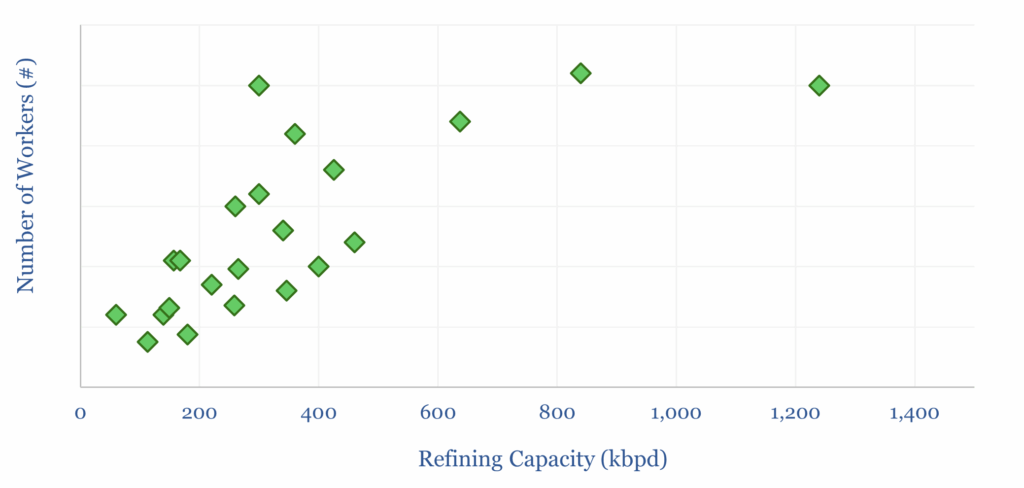
Other refining costs include labor, catalysts, O&M, G&A and taxes, which are estimated in the data-file based on industry disclosures or sum-of-the-parts build ups (example below).
To generate a 10% IRR in the Western world thus requires gross refining cracks of $20-22/bbl. Conversely, refining cracks have run at $11/bbl over the past decade. This is enough for European refiners, at the top of the global cost curve, to generate $2-4/bbl cash margins, but it is not enough to break even on an earnings basis or cover the cost of capital.
Other regions may be able to justify new refinery construction to achieve greater integration, energy security, or to integrate with petrochemical plants amidst rising plastics demand.
If global oil demand does not decline, and new refineries do need to be incentivized, it may take several years of $15-20/bbl crack spreads, or higher, compared with a historical average of $11/bbl, in order to reignite refinery construction.
Please download the data-file to stress test the economics of oil refining, capex costs, energy costs and operating costs of typical new refineries.