
This data-file aggregates total US population across all 3,150 US counties, every year, from 1970 to 2024. Population has flatlined and even declined in the densest cities with >10,000 people per square mile, but grown fastest in suburbs/exurbs with 200-1,500 people per square mile. This matters for energy use.
US population stood at 340M people in 2024. US population has been growing at 0.6% per annum over the prior decade, as aggregated in our global population and GDP database.
However, in this data-file, we have aggregated population data from the US Census Bureau, across 3,150 US counties, across all 50 States and Washington DC, to evaluate changes in population density over time. I.e., are people moving towards more or less densely populated regions?
Overall, the US population in denser urban categories has declined by -1.6% since pre-COVID times, or -0.3% per year (example charts below).
By 2024, therefore, 3% of the US lives in highly dense cities in counties with >10,000 people per square mile (e.g., Manhattan, San Francisco, Washington DC). Another 5% live in dense cities with 3,000-10,000 people per square mile (e.g., Chicago). 19% live in cities with 1,500-3,000 people per square mile (eg Los Angeles), albeit this category is still mildly growing.

Overall, the US population living in sparser counties – often suburbs and exurbs – has risen by 4.3% since pre-COVID times, or +0.9% per year. Specifically, over 60% of the US population is now concentrated in counties with population density ranging from 50-1,500 persons per square mile.
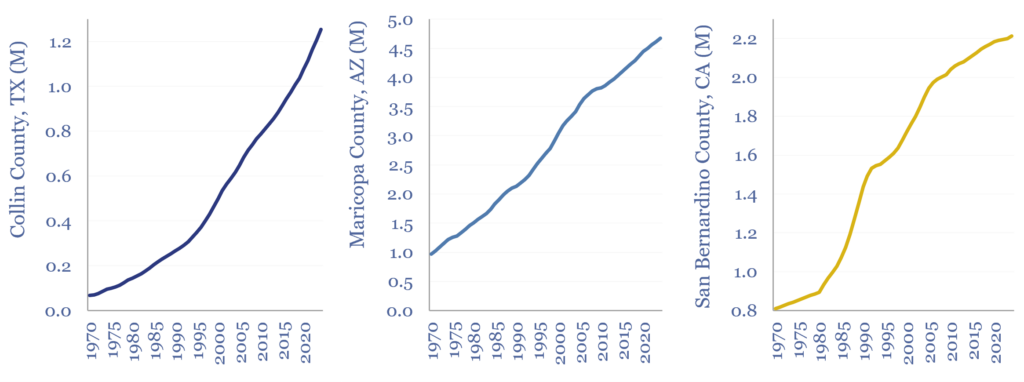
Examples in this category might include Frisco (Northern exurb of Dallas, and one of the fastest growing large counties in the US, up +21% since 2019), Maricopa county, AZ around the City of Phoenix, and San Bernardino/Sacramento, which are exurbs of Los Angeles/San Francisco.
9% of the US population lives in rural or highly sparse counties with fewer than 50 people per square mile. This category has grown at 1.2% since pre-COVID times, or 0.2% per year.
This all matters because vehicle miles traveled per capita can be 3-5x higher in exurbs and more rural communities than in dense cities, while home heating energy can also be 2x higher in larger detached homes compared with dense city apartments.
Full data on US population, by county, by year, categorized according to US population density, can be found in this data-file, after aggregating and cleaning up over 50-years of individual data-files released by the US Census Bureau.
As an update, and to confirm that similar trends are underway outside of the US, we have aggregated the UK’s population, across 2018 boroughs, in the second data-file linked below.