Search results for: “Russia”
-
Russia: a breakdown of export revenues?
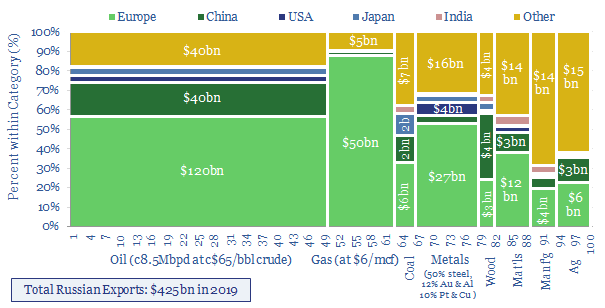
Russia’s total total exports ran at $425bn in 2019, comprising $225bn of oil, $55bn of gas, $50bn of metals, $20bn of coal, $30bn basic materials and $25bn of ag products. 55% of the total goes to Europe. This data-file gives a breakdown for 100 products across 200 countries, to allow for stress-testing.
-
Russia conflict: pain and suffering?
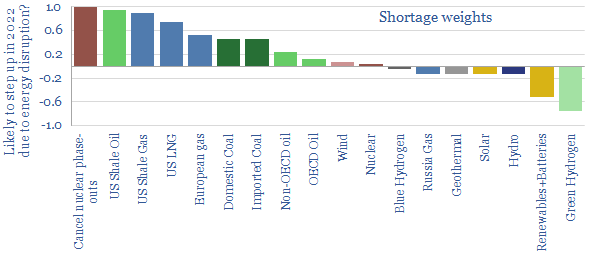
This 13-page note presents 10 hypotheses on Russia’s horrific conflict. Energy supplies will very likely get disrupted, as Putin no longer needs to break the will of Ukraine, but also the West. Results include energy rationing and economic pain. Climate goals get shelved during the war-time scramble. Pragmatism, nuclear and LNG emerge from the ashes.
-
Global oil production by country?
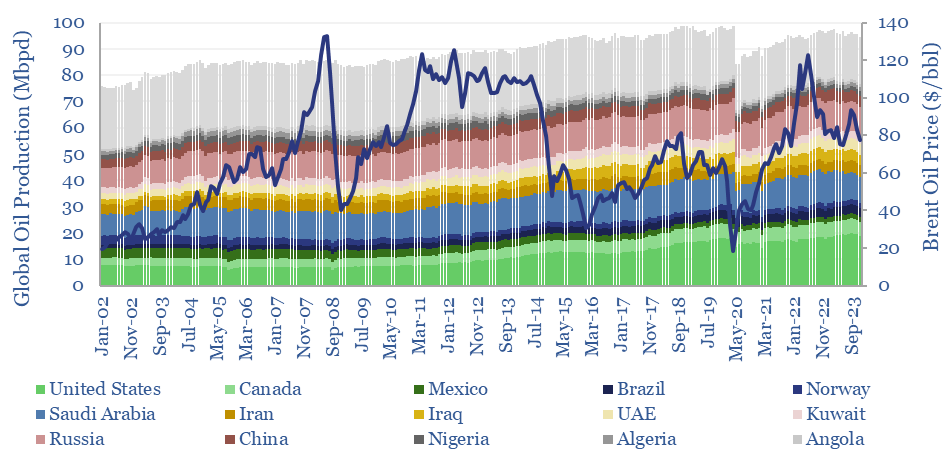
Global oil production by country by month is aggregated across 35 countries that produce 80kbpd of crude, NGLs and condensate, explaining >96% of the global oil market. Production has grown by +1Mbpd/year in the past two-decades, led by the US, Iraq, Russia, Canada. Oil market volatility is usually low, at +/- 1.5% per year, of…
-
Uranium enrichment: by country, by company, by facility?
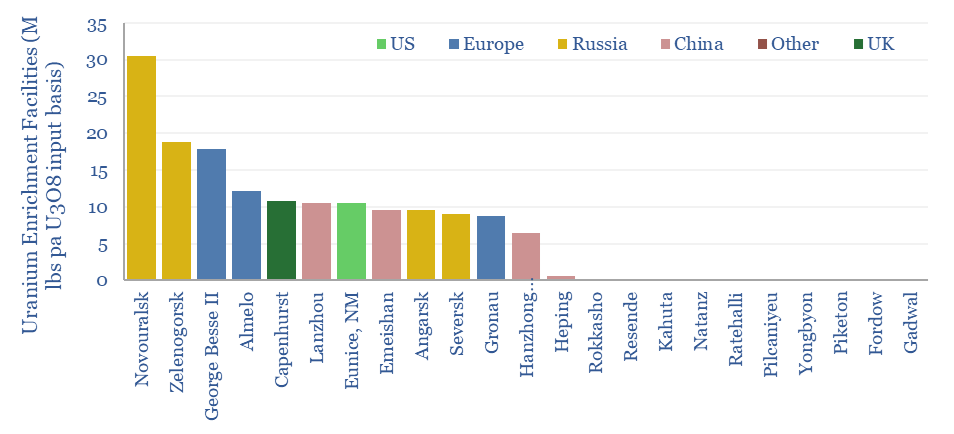
Global uranium enrichment by country, by company and by facility are estimated in this data-file, covering the 155M lbs pa uranium market. The data-file includes a build-up of enrichment facilities (ranked by SWU capacity), notes on each enrichment company and an attempt to map the world’s uranium production to where it is enriched and ultimately…
-
European shale: an overview?
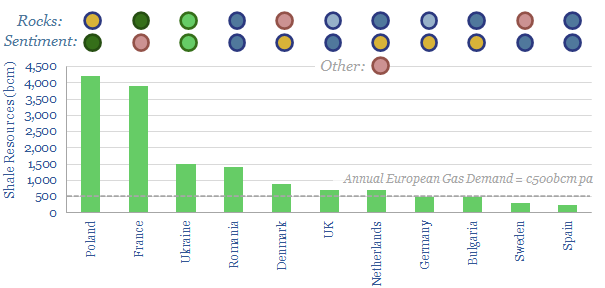
Europe has 15 TCM of technically recoverable shale gas resources. This data-file aims to provide a helpful overview, as we expect exploration to re-accelerate. Ukraine has the best shale in Europe, which may even be a motivation for Russian aggression. Other countries with good potential, held back only by sentiment are Romania, Germany, UK, Bulgaria…
-
Global electricity prices vs. CO2 intensities?
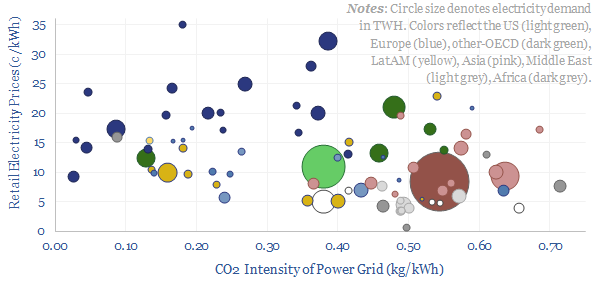
Retail electricity prices average 11c/kWh globally, of which 50-60% is wholesale power generation, 25-35% is transmission and 10-20% covers other administrative costs of utilities. The average CO2 intensity of the global average power grid is 0.45 kg/kWh. Variations are wide. And there is a -35% correlation between electricity prices vs CO2 intensities in different countries…
-
Energy self-sufficiency by country and over time?
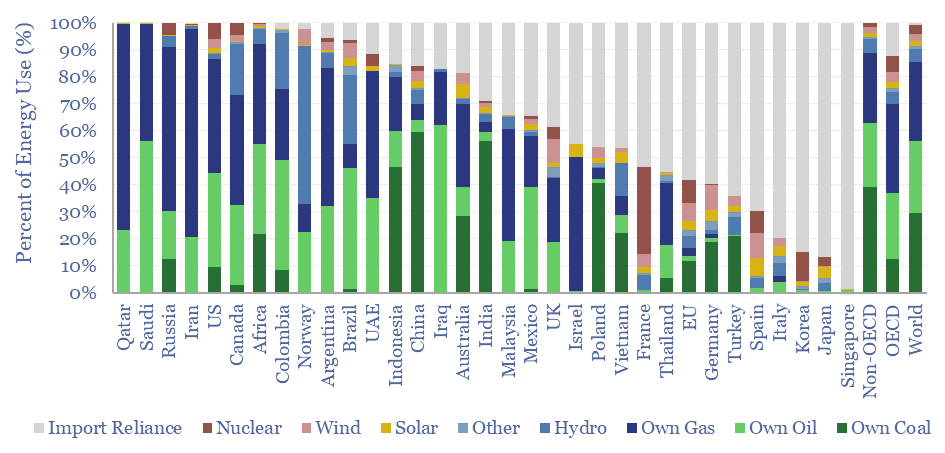
This data-file tabulates energy self-sufficiency, by country, over time, across 30 of the largest economies in the world. Among this sample, the median country generates 70% of its energy domestically, and is reliant on imports for 30% of the remainder. Energy self-sufficiency varies vastly by country.
-
The Ascent of Small Scale LNG?
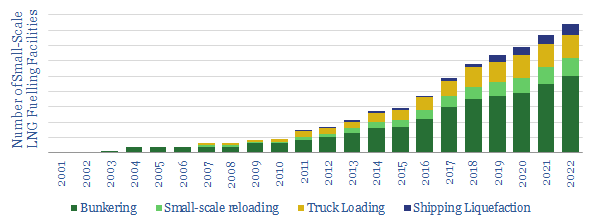
Large LNG projects make large headlines. But we are excited by the ascent of small-scale LNG facilities. At less than 1MTpa each, these facilities can be harder to track, which is the objective of this data-file. We find small LNG liquefaction capacity is set to double, to 25MTpa. Liquefaction facilities for shipping will rise 8x…
-
CO2 intensity of coal production?
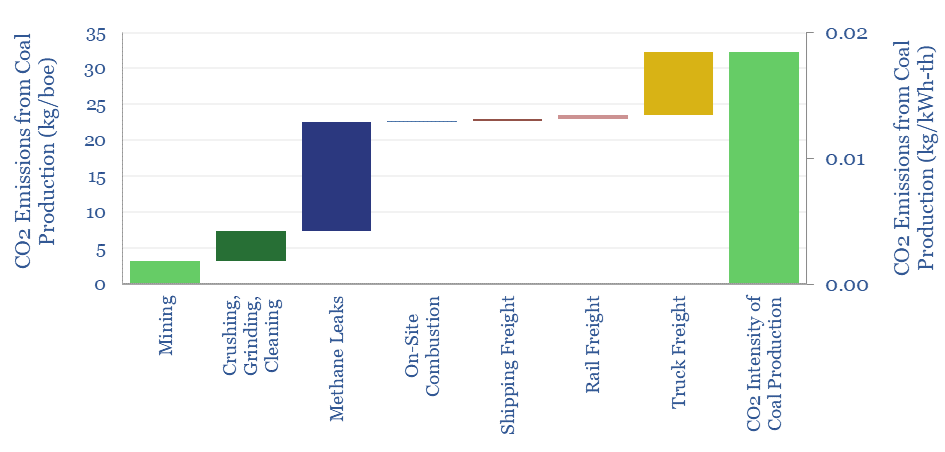
Producing a ton of coal typically emits 0.19T of CO2, equivalent to 50kg/boe. The numbers comprise mining, methane leaks and transportation. Hence domestic coal production will tend to emit 2x more CO2 than gas production, plus c2x more CO2 in combustion. However, numbers vary widely based on input assumptions, such as methane lakage rates, btu content…
-
Coal-to-gas switching: what CO2 abatement cost?
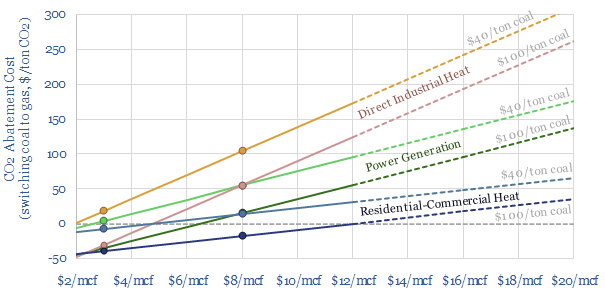
Coal-to-gas switching halves the CO2 emissions per unit of primary energy. This data-file estimates the CO2 abatement costs. Gas is often more expensive than coal. But as a rule of thumb, a $30-60/ton CO2 price makes $6-8/mcf gas competitive with $60-80/ton coal. CO2 abatement costs are materially lower in the US and after reflecting efficiency.…
Content by Category
- Batteries (89)
- Biofuels (44)
- Carbon Intensity (49)
- CCS (63)
- CO2 Removals (9)
- Coal (38)
- Company Diligence (95)
- Data Models (840)
- Decarbonization (160)
- Demand (110)
- Digital (60)
- Downstream (44)
- Economic Model (205)
- Energy Efficiency (75)
- Hydrogen (63)
- Industry Data (279)
- LNG (48)
- Materials (82)
- Metals (80)
- Midstream (43)
- Natural Gas (149)
- Nature (76)
- Nuclear (23)
- Oil (164)
- Patents (38)
- Plastics (44)
- Power Grids (130)
- Renewables (149)
- Screen (117)
- Semiconductors (32)
- Shale (51)
- Solar (68)
- Supply-Demand (45)
- Vehicles (90)
- Wind (44)
- Written Research (354)