Search results for: “refining”
-
Rare Earth mining and refining: the economics?
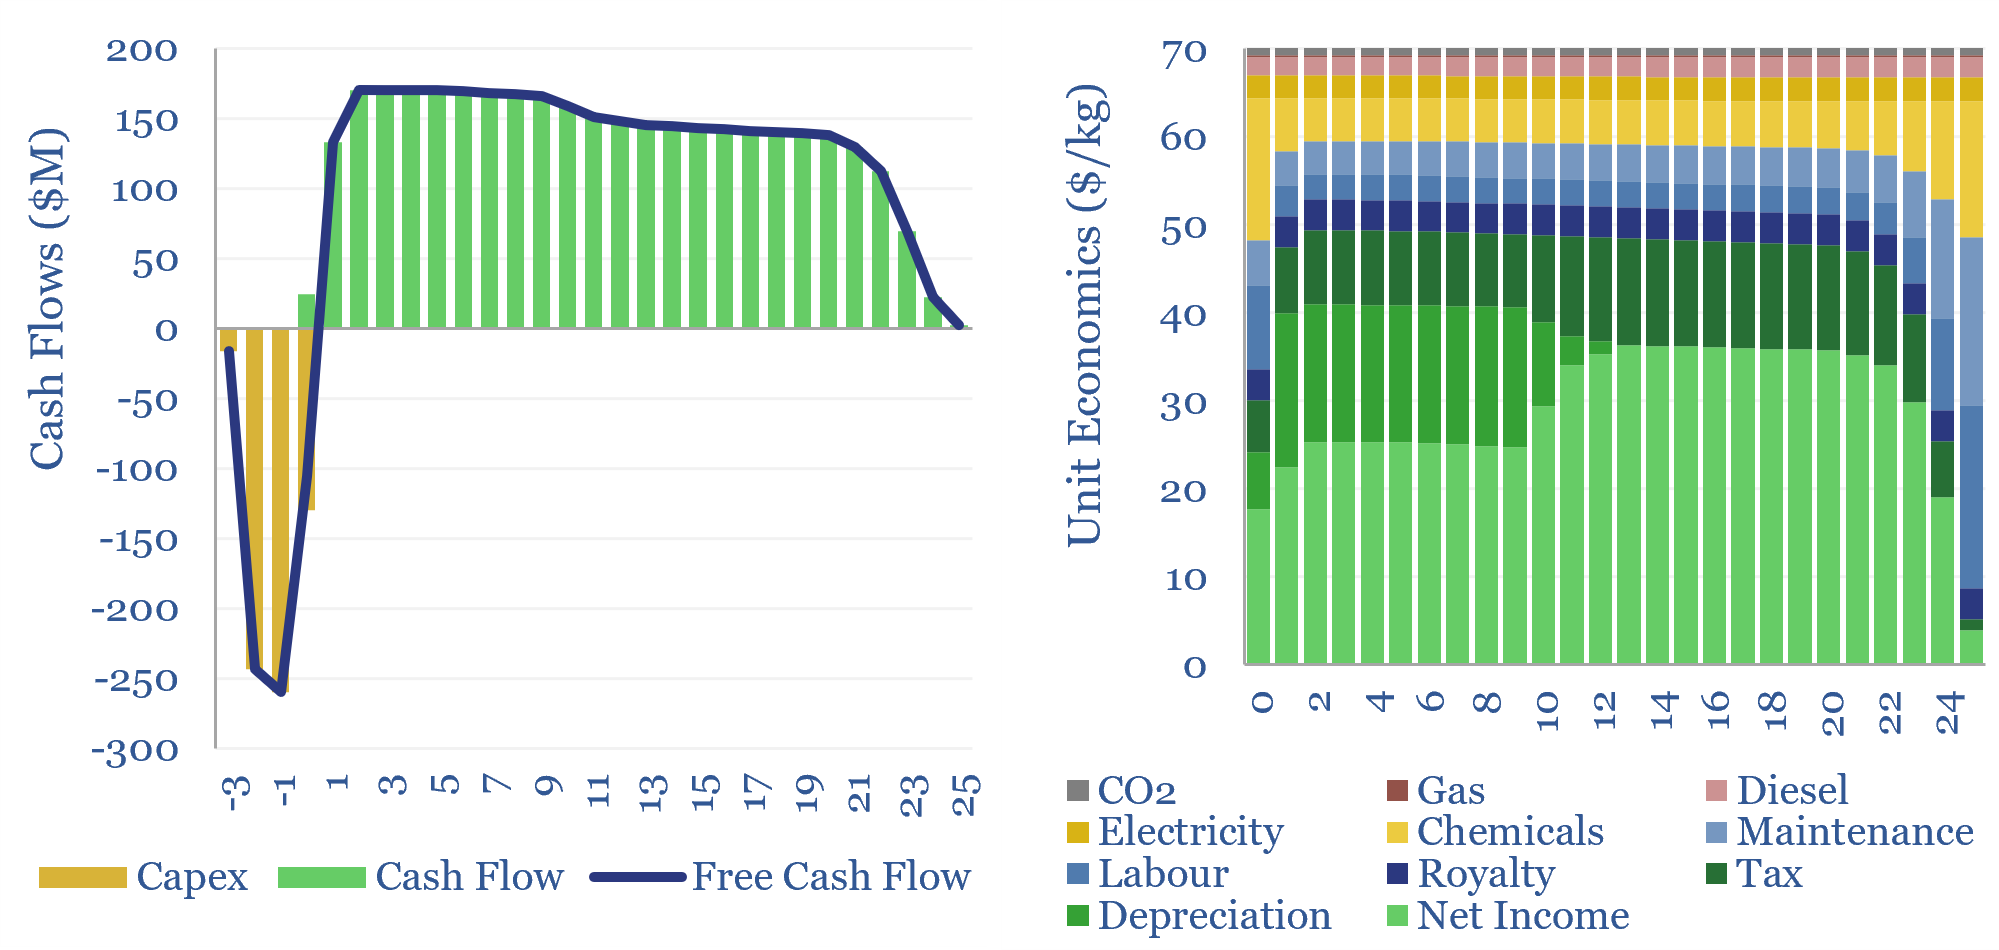
The costs of Rare Earth mining and refining are captured in this model, requiring a $70/kg blended product price, to generate a 20% IRR on $150,000/Tpa of capex. Primary energy intensity exceeds 100 MWH/ton and CO2 intensity exceeds 20 tons/ton. Economics are particularly sensitive to ore grade, recovery rates and chemical costs.
-
US Refining: energy and CO2 intensity
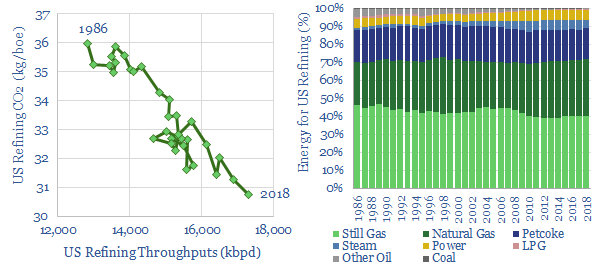
Emissions of refining a barrel of crude in the US has fallen at a 0.5% CAGR over the past c30-years, from 36kg/boe in 1986 to 31kg/boe in 2018. US refineries are also increasingly fueled by natural gas and merchant steam, while own use of oil, coal and oil products have been phased out.
-
Leading PGM producers: mining, refining and recycling?
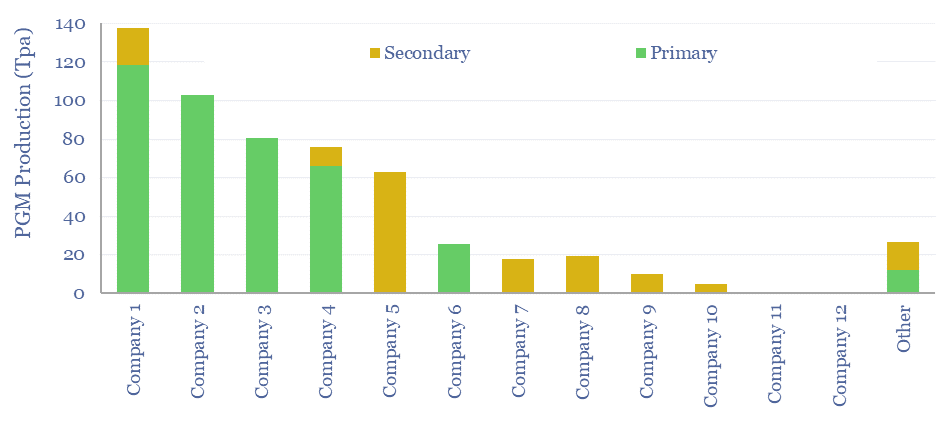
This data-file is a screen of leading PGM producers and recyclers. Eight companies control 90% of global production. Most are mid-caps. Four have primary listings in South Africa. Three are listed in Europe and the UK. Ore grades average 4 grams/ton, and recovery requires 60GWH/ton of energy, emitting 40kT/ton of CO2. But do recent company…
-
Low-carbon refining: insane in the membrane?
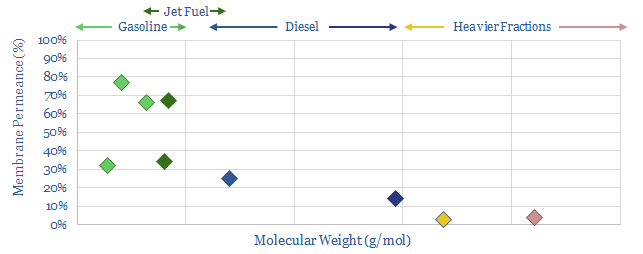
1% of global CO2 comes from distilling crude oil at refineries. An alternative uses precisely engineered polymer membranes to separate crude fractions, eliminating 50-80% of the costs and 97% of the CO2. We reviewed 1,000 patents, including a major breakthrough in 2020. This 14-page note presents the opportunity.
-
US Refinery Database: CO2 intensity by facility?
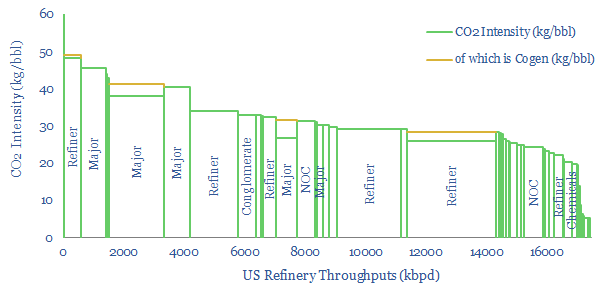
This US refinery database covers 125 US refining facilities, with an average capacity of 150kbpd, and an average CO2 intensity of 33 kg/bbl. Upper quartile performers emitted less than 20 kg/bbl, while lower quartile performers emitted over 40 kg/bbl. The goal of this refinery database is to disaggregate US refining CO2 intensity by company and…
-
Overview of Downstream Catalyst Companies
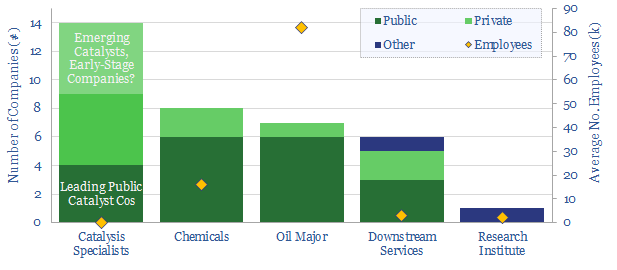
This data-file tabulates headline details of c35 companies commercialising catalysts for the refining industry, in order to improve conversion efficiencies and lower CO2 emissions. Five early-stage private companies stand out, while we also profile which Majors have recently filed the most patents to improve downstream catalysis.
-
Global hydrogen: market breakdown?
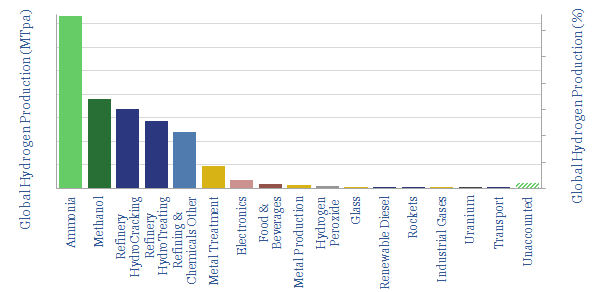
This data-file is a global hydrogen market breakdown, disaggregating the 110MTpa market (mainly ammonia, methanol and refining), how it is met via different production technologies, and our estimates of those technologies’ costs (in $/kg) and CO2 intensities (in kg/kg or tons/ton).
-
Heating-melting: how much energy is needed?
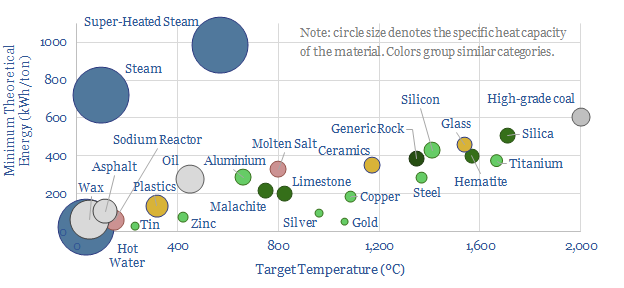
How do we quantify the minimum energy needed to heat materials and melt materials? This data-file calculates values, in kWh/ton, from first principles, based on target temperatures, specific heat capacities and latent heat capacities. A good rule of thumb is 25 kWh of useful energy to heat each ton of material by each 100ºC.
-
Rare earth companies: screen of miners and refiners?
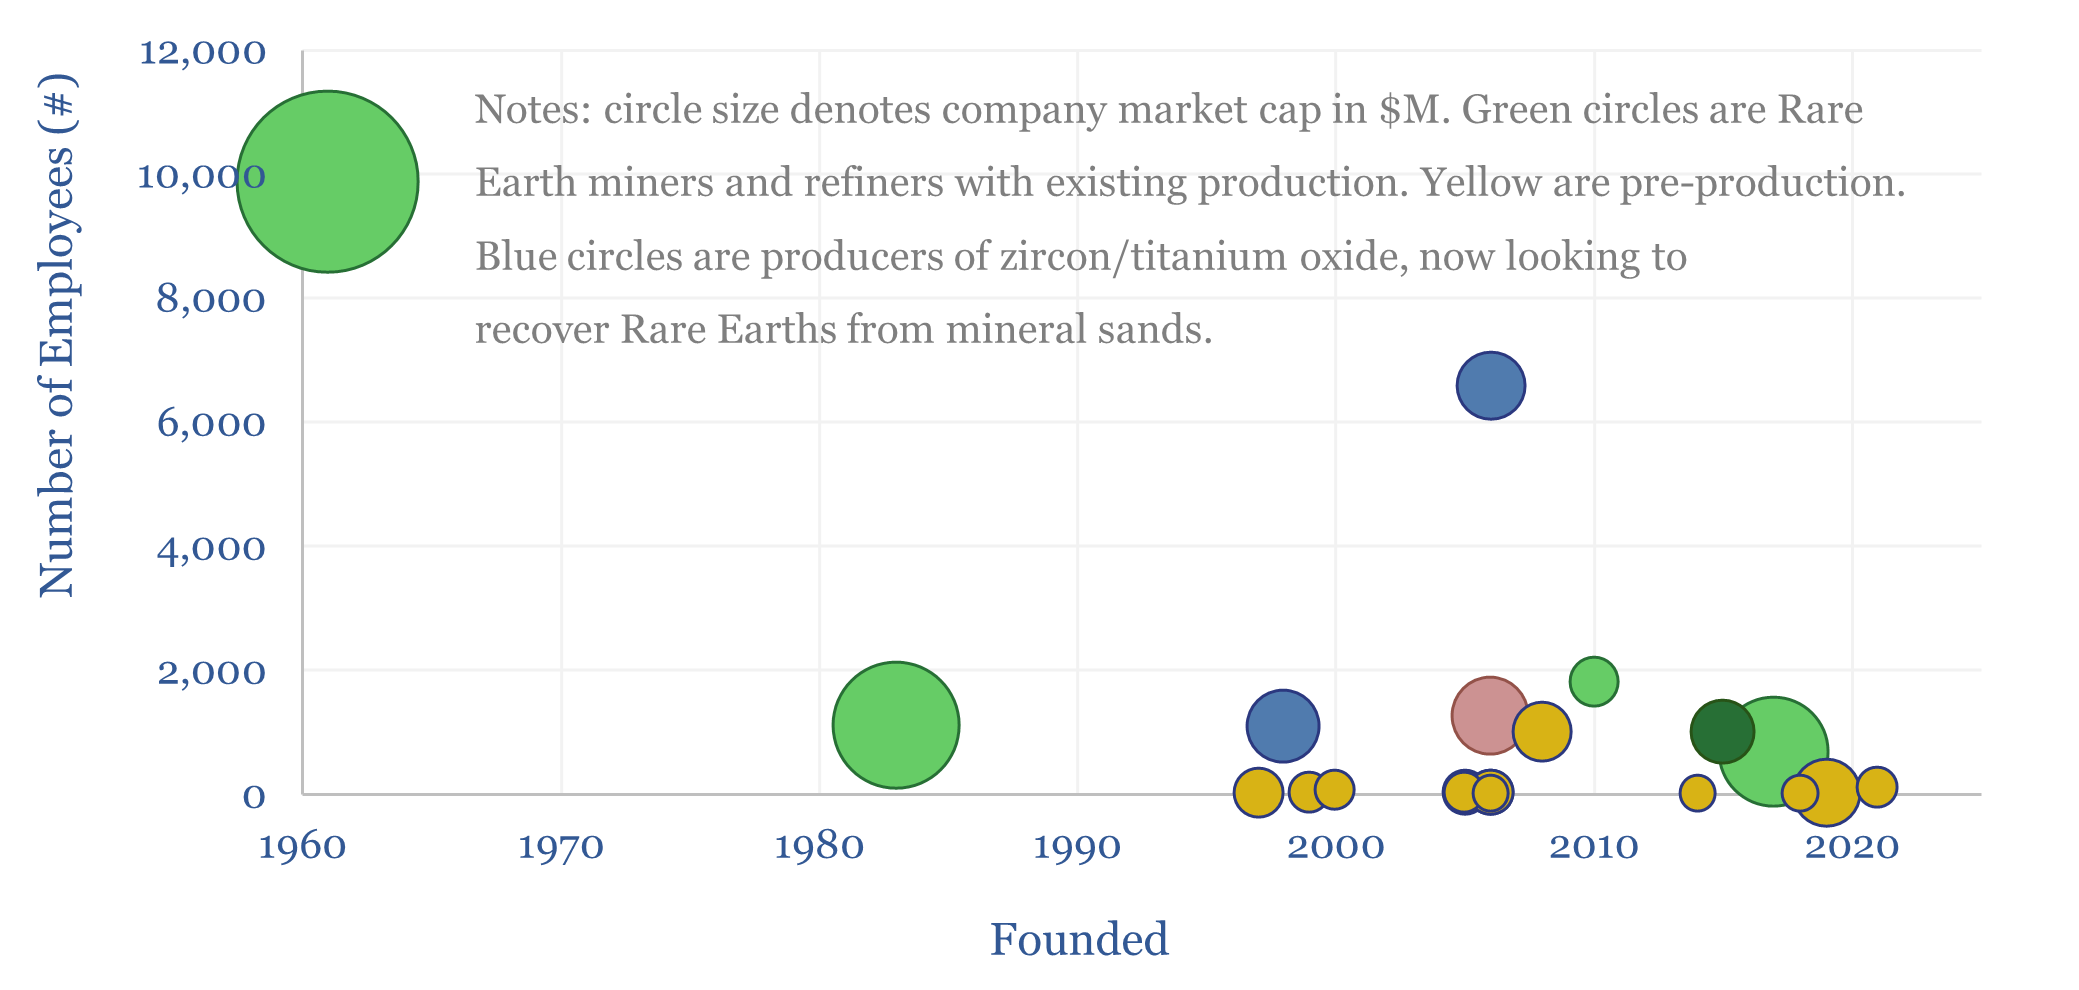
This screen of Rare Earth miners and refiners captures 20 Rare Earth companies, their flagship projects, and economic parameters such as capex, ore grades, end products and NPVs. A vibrant landscape is evolving, especially for NdPr and DyTb, although the market is still risking pre-produdction projects heavily.
-
Carbon Costs of IMO 2020?
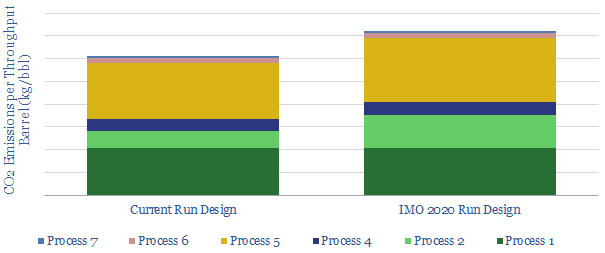
CO2 intensity of oil refineries could rise by 20% due to IMO 2020 sulphur regulations, if all high-sulphur fuel oil is upgraded into low-sulphur diesel, we estimate. The drivers are an extra stage of cracking, plus higher-temperature hydrotreating, which will also increase hydrogen demands. This one change could undo 30-years of efficiency gains.
Content by Category
- Batteries (89)
- Biofuels (44)
- Carbon Intensity (49)
- CCS (63)
- CO2 Removals (9)
- Coal (38)
- Company Diligence (95)
- Data Models (840)
- Decarbonization (160)
- Demand (110)
- Digital (60)
- Downstream (44)
- Economic Model (205)
- Energy Efficiency (75)
- Hydrogen (63)
- Industry Data (279)
- LNG (48)
- Materials (82)
- Metals (80)
- Midstream (43)
- Natural Gas (149)
- Nature (76)
- Nuclear (23)
- Oil (164)
- Patents (38)
- Plastics (44)
- Power Grids (130)
- Renewables (149)
- Screen (117)
- Semiconductors (32)
- Shale (51)
- Solar (68)
- Supply-Demand (45)
- Vehicles (90)
- Wind (44)
- Written Research (354)