-
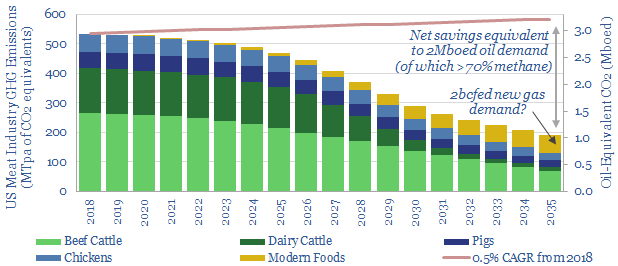
Disrupting Agriculture: Energy Opportunities?

Precision-engineered proteins are on the cusp of disrupting the agriculture industry. The science is improving rapidly, to create meat-substitutes with vastly superior nutrition, taste and costs. We explore the energy consequences of “replacing cows”, with potential for 2bcfd upside to US gas demand, to offset the CO2 of all US oil demand, increase US biofuels…
-
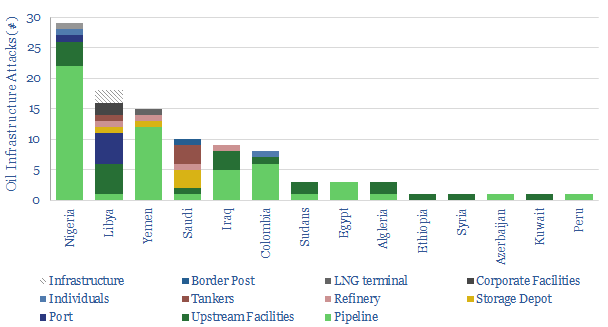
Drone Attacks on Energy Assets?

A devastating new wave of drone technologies could place the world’s largest and most vulnerable energy infrastructure into the firing line of aggressors. This short note reviews the ten facets of drone swarms that make them so dangerous. Hence we are increasingly concerned over supply disruptions in the 2020s.
-
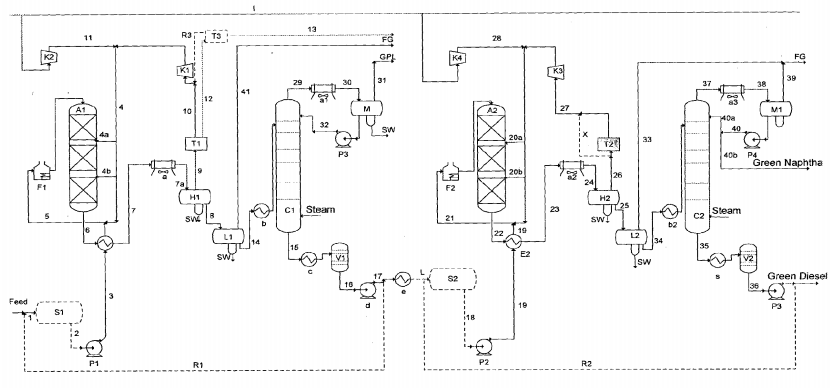
Do refineries become bio-refineries?

Will the future of refineries be to convert to bio-refineries, in order to meet a growing need for decarbonised fuels? This note reviews the opportunities and challenges, based on patent filings from Eni: the industry leader in bio-refinery technology. Costs are 80% below newbuilds, but we question ultimate scale and the ability to lower palm…
-
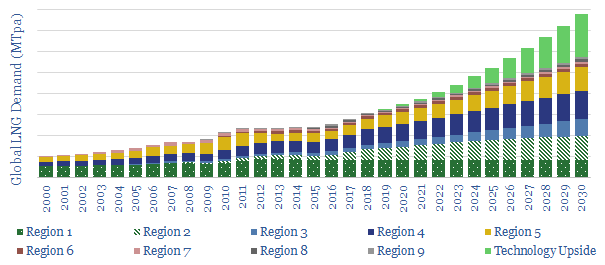
The Ascent of LNG?

This note outlines 200MTpa of potential upside to consensus LNG demand, due to emerging technologies, in power and transportation. LNG use could thus compound at an 8% CAGR to 800MTpa by 2030, justifying greater investment in unsanctioned LNG projects.
-
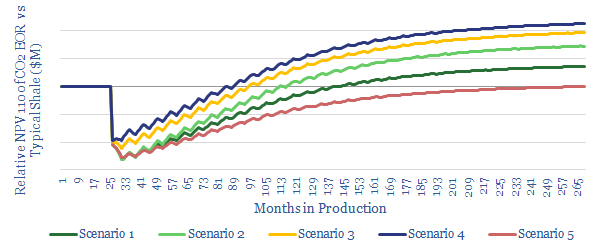
CO2-EOR in shale: the holy grail?

What if there were a technology to sequester CO2, double shale productivity, earn 15-30% IRRs and it was on the cusp of commercialization? Promising momentum is building, at the nexus of decarbonised gas-power and Permian CO2-EOR. This short note highlights the economic opportunity.
-
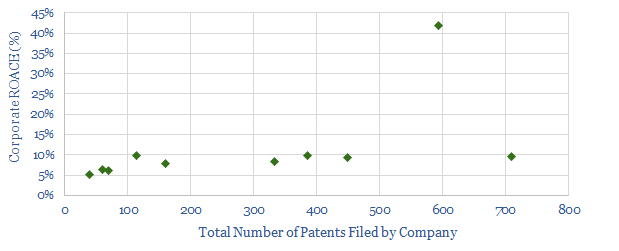
Does Technology Drive Returns?

30-60% of Oil Majors’ ROACE is explained by their technologies. This is our finding from correlating 3,000 oil patents versus returns on capital. Technology leaders can generate 2x higher corporate ROACEs. Downstream segments are most sensitive.
-
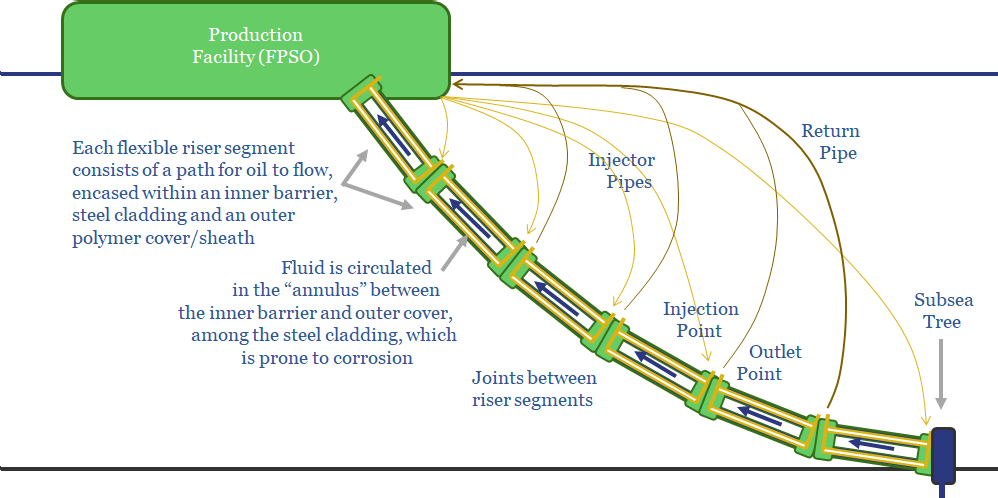
New Risers for pre-salt Brazil?

Petrobras has patented next-generation riser designs, to handle sour-service crude from pre-salt Brazil. This is needed after riser-failures at Lula. But complexity is an order of magnitude higher for Petrobras’s new solution. A simpler alternative is the growing potential from thermo-plastic composite pipe.
-
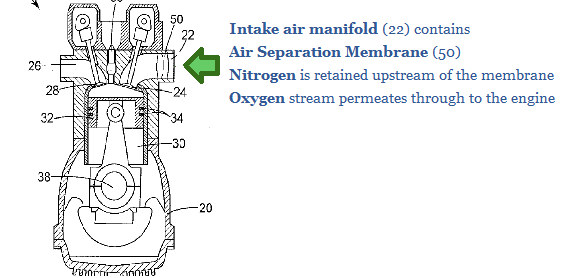
De-Carbonising Cars. Can Oxy-Combustion Save Gasoline?

Could next-generation combustion technologies be used to decarbonise oil-fired transportation, raising the trajectory of long-term oil demand? We review a leading oil company’s patents to commercialise oxy-combustion in vehicles, along with the challenges. The outlook remains more positive for gas than for oil.
-
Permian CO2-EOR: pushing the boundary?

We see enormous opportunity in CO2-EOR in the Permian basin. Occidental Petroleum has now published laboratory analysis, informing its models and de-risking the technique. This short note profiles our “top five” conclusions from the paper.
-
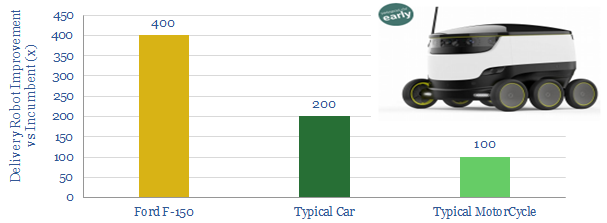
Robot delivery: Unbelievable fuel economy…

Small delivery robots can achieve 100-400x higher fuel economies than conventional, oil-powered vehicles. We profile Starship, whose fleet is now covering c400km/day. Energy demand in transportation is evolving.

Content by Category
- Batteries (89)
- Biofuels (44)
- Carbon Intensity (49)
- CCS (63)
- CO2 Removals (9)
- Coal (38)
- Company Diligence (95)
- Data Models (840)
- Decarbonization (160)
- Demand (110)
- Digital (60)
- Downstream (44)
- Economic Model (205)
- Energy Efficiency (75)
- Hydrogen (63)
- Industry Data (279)
- LNG (48)
- Materials (82)
- Metals (80)
- Midstream (43)
- Natural Gas (149)
- Nature (76)
- Nuclear (23)
- Oil (164)
- Patents (38)
- Plastics (44)
- Power Grids (130)
- Renewables (149)
- Screen (117)
- Semiconductors (32)
- Shale (51)
- Solar (68)
- Supply-Demand (45)
- Vehicles (90)
- Wind (44)
- Written Research (354)