Our Top Ten Research Notes of 2020

top research notes of 2020

We published 250 new research notes and data-files on our website in 2020. The purpose of this review is to highlight the ‘top ten’ reports. This includes our economic roadmap to reaching ‘Net Zero’, the greatest risks and opportunities that we have found in the transition, and the analysis that has most shaped our views.


(1) The single most powerful decarbonization option in all of our work is reforestation. Costs are as low as $3-10/ton. There is 15GTpa of carbon-offsetting potential (note here). But this is not an investment. It is an act of charity. It matters because increasing numbers of decision-makers are choosing to restore nature and offset their CO2 at low cost, rather than purchasing higher-cost new energies, which could make them uncompetitive.

(2) Restoring soil carbon is equally powerful, and surprisingly fascinating. Agricultural soil has lost three-quarters of its carbon since pre-industrial times. Restoring it could offset another 3-15GTpa of CO2. With a $30/ton CO2 price, mid-Western farmers could make more money farming carbon than corn. The theme would also disrupt the global fertilizer industry.

(3) Is energy transition becoming a bubble? If you read a single piece of research on energy transition this year, I would recommend this one. We fear an “investment bubble” is forming in the energy transition space. Half of all transition technologies we have evaluated are on the “wrong” side of the cost curve and may be displaced by the nature based solutions we described above.. Deflation and profitability are often antagonistic. And some spaces have seen incredible run-ups despite challenging economics and overlooked technical challenges. The purpose of this note is to suggest pragmatic responses.

(4) The green hydrogen economy may be the largest bubble. Our work this year has assessed the theme in detail, both in power markets and as a transportation fuel. Costs are immutably high. This is due to the laws of physics and thermodynamics. Transporting green hydrogen will also be more challenge than any other commodity in history (note here). The note below is the best overview of our work. Many expect c80% deflation in the total costs of electrolysers. Our data suggest this is impossible. We welcome challenges to these numbers, but so far, have not received any from our contacts in the hydrogen industry.

(5) The green hydrogen bubble will give way to blue. Blue hydrogen is not just a low-carbon fuel. More importantly, it is the most economic and practical route to establishing large-scale carbon capture and storage. Economics are 80-90% superior to green hydrogen. Risks are materially lower. Our research note ends by identifying projects that should reach FID in 2021, and a public company with a clear ‘moat’ in the space.

(6) Non-obvious opportunities. Other novel technologies have a vast role in the route to Net Zero. The non-obvious opportunities are best, and are not at risk of becoming bubbles. Our research has covered many examples in 2020: deep geothermal, supercapacitors eclipsing batteries, industrial efficiency initiatives such as fully subsea offshore or next-generation refining; and backing up renewables with CHPs, PCMs and smart energy systems. If you read one research note into a non-obvious opportunity, we recommend this deep-dive below into additive manufacturing, which will re-shape every industry globally.

(7) Patent analysis can give you an edge identifying opportunities in the energy transition and, and avoiding hidden risks, particularly as bubbles build. Our note below lays out six themes, including worked examples, based on reviewing over 1M patents.

(8) Our most economic roadmap to Net Zero ties together all of our work. We find it is possible to decarbonize global energy by 2050, even as global energy demand rises by 65%. The total cost of decarbonization is $50trn, which is almost halved versus last year’s estimate in December-2019. The fully decarbonized energy system still contains 85Mbpd of oil and 375TCF per year of natural gas.

(9) Oil and gas are heading for devastating under-supply if our analysis is correct. This is historically precedented during technology transitions. Below we have evaluated supply-demand and pricing in the whale oil industry from 1805-1905, as it was disrupted by rock oil and later by electric lighting. Whale oil prices outperformed over this timeframe, as supply peaked before demand. Our latest our oil market outlook is here, and our gas market outlook is here.

(10) The optimal strategy for incumbent energy companies is thus suggested in our research note below. We argue that Energy Majors embracing these principles can uplift their valuations by c50% (assuming flat commodity prices).

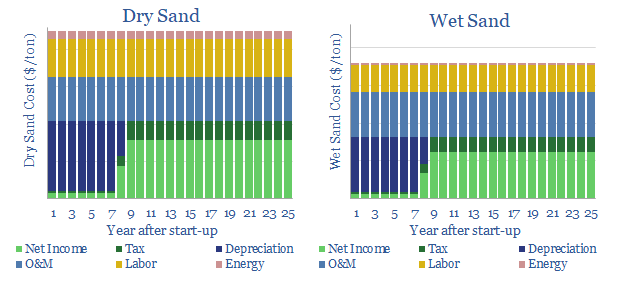
Wet sand: what impacts on shale breakevens and CO2?

wet sand for hydraulic fracturing in shale play

A fully decarbonized energy system may still require 85Mbpd of oil and 375TCF of gas. Hence a focus of our research is to find improved technologies that can improve the efficiency and lower the CO2 intensity of oil and gas production. This note profiles the exciting new prospect of ‘wet sand’ for hydraulic fracturing in shale plays. It can reduce breakeven costs up to $1/bbl and CO2 intensity up to 0.6kg/bbl.


Wet sand is defined as having a moisture content between 1% and 10% by weight. This is opposed to the 43MTpa of dry sand supplied in the Permian in 2018, where all the moisture has been burned away in a kiln, shortly after the washing process.

Wet sand has reached technical maturity. In a December-2020 technical paper, PropX described a patent pending process to “screen, transport, deliver and meter wet sand from local mines to the frac blender, bypassing the drying process altogetherโ€.

A full trial of wet sand has also been undertaken at a 10-well pad in Oklahoma, implied to have been operated by Ovintiv. Over 4Mlbs of sand per day was delivered and pumped downhole. The system was reliable and consistently flowed wet sand with 4-8% moisture content.

The advantages: cost and CO2 savings?

Cost savings from pumping wet sand are estimated at $2-10/ton. The largest capital component is in potential capex savings, as the kiln at a sand mine usually comprises $20-50M (including associated drying, storage and conveyance) out of a $180M total budget at a 2.5MTpa mine. A second saving is in opex, as labor costs average $5/ton across 15 surveyed sand mines (chart below), and the drying unit requires one-third of the labor force. Finally, there are fuel savings, likely around $1/ton.

After modelling the economics below, our base case estimate is that a greenfield sand mine can lower its total production costs by $5/ton, with a shift from dry to wet sand.

To test the economic impacts of a $5/ton reduction in sand costs, we turn to our economic model below. At a large, sand-intensive well, we estimate $0.1M of potential savings. This flows through to a $0.5/bbl reduction in the well’s NPV10 breakeven. However, the savings will be lower at industry average wells, which only consume 10-20M lbs of proppant.

CO2 savings are realized by cutting out fuel demand in the drying kilns at sand mines, typically at 0.3-0.4mmbtu per ton of dried sand, requiring 0.4mcf of gas, whose combustion would release 20kg of CO2. Again, we can run the savings through our models (below) and estimate CO2 could be reduced by up to 0.6kg/boe, which is not bad against a baseline of 26kg/boe of total upstream Scope 1 and Scope 2.

HSE advantages are also noted in the technical paper. Fugitive silica dust is materially reduced, as wet sand particles adhere to one-another. This helps meet OSHAโ€™s 2016 silica exposure limits, below 50mg/m3 of air, averaged over an 8-hour shift.

The challenges: is wet sand more difficult to pump?

The challenge of wet sand is that wet san grains cohere to one-another, which impedes their smooth flow and can cause sand to “clump together”. In cold climates (but probably not Texas!) the water molecules can also freeze. Hence, PropX notes three areas where it has needed to innovate the sand supply chain.

Last-mile. It is recommended to use containers (rather than trailers) to transport sand to well-sites. These can be lifted from trucks onto the wellsite with โ€œthe fewest touch points and the least modificationโ€.  A typical container system carries 23,000-27,000lbs of sand, with a capacity of 28,500 lbs. These volumes have been emulated by PropX, by enlarging the container opening (from 20โ€ diameter to 6โ€™x6โ€™, and covering it with a tarp, as is widely used in transportation of agricultural products.

Emptying containers is easy with dry sand as it flows naturally, emptying in c60-seconds. Wet sand containers need to be emptied into a blender hopper. This likely takes 120-seconds, via a 100bpm slurry rate carrying 2.7ppg of sand. PropX has undertaken successful trials placing the sand containers on a vibration table, with a sloped discharge cone, silicon-inserts to lower friction and a larger discharge exit gate.

Sand delivery to the well must occur at a rate of 16,800 lbs of sand per minute, for example, comprising 80-100bpm of slurry carrying 0.5-4.0ppg of sand. A unique belt has been designed which can carry up to 7.9ppg at up to 100bpm. It includes a metering system and screwless surge hopper, also on vibrating tables, to enable accurate, reliable and continuous pumping of wet sand without the risk of bridging.

Sand has undergone huge changes in the past, which suggests this supply chain is not ossified. For example, back in 2017, 90% of sand was shipped by rail to the Permian from Minnesota, Illinois and Wisconsin. Today there are 50 โ€œlocalโ€ sand mines in the Permian basin, with 107MTpa of capacity. This has reduced transload cost, and allowed sand pricing to run as low as $20/ton recently. Further deflation may lie ahead.

Why it matters: deflation and CO2 reduction?

A fully decarbonized energy system may still require 85Mbpd of oil and 375TCF of gas, as per the conclusion of our research to date. Hence a focus of our research is to find improved technologies that can improve the efficieny and lower the CO2 intensity of oil and gas production.

We still see great productivity enhancements ahead for the shale industry, after reviewing over 1,000 technical papers. A 5% CAGR is possible from 2019’s baseline.

There is also great potential for shale to lower its CO2 intensity, potentially towards zero (Scope 1 and 2 basis), as argued in our recent research (below). The potential is further enhanced by using waste water to cultivate nature based solutions (also below).

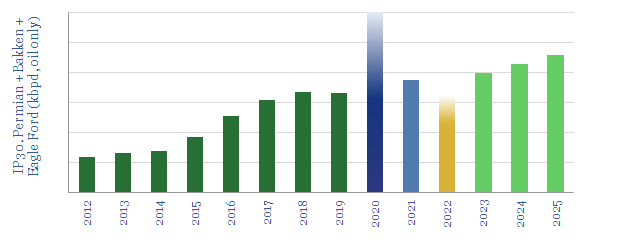
Shale thus sets the marginal cost in oil markets, as our numbers require of 2.5Mbpd of shale growth each year from 2022-2025 (models below).

https://thundersaidenergy.com/downloads/2020-oil-markets-bounding-the-uncertainty/

But nearer-term we see risks, that sentiment will sour around shale capex, while productivity could temporarily disappoint during the COVID recovery.

Bio-engineer plants to absorb more CO2?

Bio-engineer plants to absorb more CO2?

Our roadmap towards ‘net zero’ requires 20-30GTpa of carbon offsets using nature based solutions, including reforestation and soil carbon. This short note considers whether the task could be facilitated by bio-engineering plants to sequester more CO2. We find exciting ambitions, and promising pilots, but the space is not yet investable.


What is bio-engineering? In 2016, scientists at DuPont gene-edited maize to grow more effectively in dry conditions. In 2017, researchers at the University of Oxford introduced a maize gene into rice plants, to increase the number of photosynthetic chloroplasts surrounding leaf veins. In 2019, scientists at Huazhong Agricultural University gene-edited rice to tolerate higher soil salinity. These are examples of bio-engineering: modifying the genetic code of plants for practical purposes.

How could it help? The world’s land plants absorb 123GTpa of carbon each year through photosynthesis. 120GTpa is re-released through respiration and decomposition. The result is a net sink of 3GTpa. For contrast, total anthropogenic carbon emissions are 12GTpa. It follows that small changes in the natural carbon cycle could materially shift carbon balances, per our climate model below.

The limitations of photosynthesis. Photosynthesis uses sunlight to convert CO2 into plant-sugars. It is only 1-5% inefficient, suggesting great potential for improvement. It is also vastly complex, comprising over 170 separate sub-stages. Amidst the complexity, RuBisCO is the most crucial limitation.

The limitations of RuBisCO. RuBisCO is an enzyme that catalyzes the reaction between CO2 and RuBP during photosynthesis. However, the RuBisCO enzyme is imprecise. It evolved at a time when the worldโ€™s atmosphere contained much lower oxygen concentrations. Unfortunately, under present atmospheric conditions, 20-35% of RuBisCOโ€™s catalytic activity reacts O2 with RuBP, instead of CO2. The resultant products cannot continue their biochemical journey into becoming sugars. Instead, they are broken down in the process of photorespiration. Photorespiration uses up c30% of the total energy fixed by photosynthesis, and re-releases CO2 into the atmosphere. Photorespiration lowers agricultural yields by 20-40%.

What if RuBisCO could be helped to fix more CO2 and less oxygen? One way to do this is to increase the atmospheric concentration of CO2 in greenhouses, which can increase crop yields by c30%, per our note below. Another way is through bio-engineering.

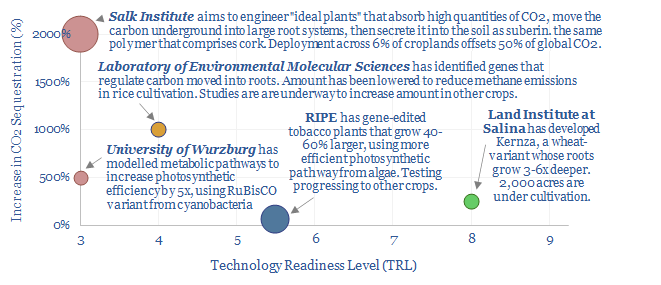
Realizing Increased Photosynthetic Efficiency (RIPE) is a research institute funded by the Bill and Melinda Gates Foundation, UK foreign aid, the USDA and academic institutions. It aims to generate higher crop yields per unit of land, using bioscience. After ten years of research, RIPE has recently modified tobacco plants with genes from green algae and pumpkin plants to reduce the energy penalties from photorespiration. The result is that these modified tobacco plants grew 40% larger. A follow-up study may achieve plants that are 60% larger. Similar modifications are also being tested on soybeans and cowpea plants.

Researchers at the University of Wurzburg have also modelled metabolic pathways that may increase the photosynthetic efficiency of plants, potentially by as much as 5x, with results published in 2020. The work uses synthetic CO2-fixating carboxylases, RuBisCO from cyanobacteria, and additional methods of preventing fixed CO2 from being re-released. Experiments are planned to test the work in tobacco plants and thale cress.

Increasing photosynthetic efficiency and crop yields could be a crucial help, lowering the land intensity of crop production, which covers 1.7bn hectares of the globe today (data below). For comparison, our target of 15GTpa of reforestation will require 1.2bn hectares of land, hence any material reductions in cropland requirements will be helpful.

Sequestering more of the CO2. 50-95% of the carbon that is stored in natural eco-systems is not stored in biomass above ground, but in the soil. An emerging set of agricultural practices that restore soil carbon are explored in our research note below. But another option is to ‘program’ plants to grow deeper, larger roots, which push more carbon into soils.

The Land Institute in Salina, Kansas has developed a grain called Kernza. It is derived from an ancestor of wheat. It is perennial, rather than requiring yearly replanting. Its roots reach 3-6x further into the soil than conventional wheat, which connotes 3-6x more carbon storage, and also promotes drought resistance. It is being grown across 2,000 acres today.

The US Department of Energy also has a Laboratory of Environmental Molecular Sciences, aiming to increase carbon transfer into the soil. One team has developed a strain of rice that emits less methane, as it contains a gene from barley, reducing the carbon that the plant moves underground, which in turn reduces the carbon that can be metabolized by anaerobic bacteria. Studies are underway to reverse the process and increase the carbon that crops move underground.

The Salk Institute for Biological Studies is based in La Jolla, California. It is undertaking the most elaborate program to bioengineer crops and other plants, to sequester up to 20x more CO2 than conventional crops. Deploying these plants across 6% of the world’s agricultural lands are said to potentially offset 50% of global CO2 emissions.

Salk’s Harnessing Plants Initiative started in 2017 and aims to grow โ€œideal plantsโ€ with greater efficiency at pulling CO2 from the air, deeper roots that store more carbon underground, and other superior agricultural properties. One pathway is to promote production of suberin, the carbon-rich polymer in cork (but also found in melon rinds, avocado skins and plant roots). This is a waxy, water-resistant compound that degrades very slowly, thus remaining in the soil for centuries.

In 2019, Salkโ€™s team discovered a gene, which determines whether roots will grow shallow or deep. It is called EXOCYST70A3, and affects the distribution of the PIN4 protein. PIN4 modulates the transport of auxin, a hormone that regulates root architecture. Different alleles of EXOCYST70A3 can increase root depth and plant resistance.

Technical readiness is the challenge for all of the bio-engineering methods discussed above. We generally begin integrating technologies into our models (first with high risking, later with lower risking) once they have surpassed TRL7. No bio-engineering method is there yet. Salk received a $35M grant in 2019, to accelerate its work, but prototype crop variants (corn, soybean, rice) are still not foreseen for five years. More pessimistically, scientists at RIPE have said it could take 15-years to deploy enhanced crops in the field. So while we will track this technology, it is not yet moving our models.

The Amazon tipping point theory?

The Amazon tipping point theory

The Amazon tipping point theory postulates that another 2-10% deforestation could make the world’s largest tropical rainforest too dry to sustain itself. Thus the Amazon would turn into a savanna, releasing 80GT of carbon into the atmosphere, single-handedly inflating atmospheric CO2 by 40ppm (to well above the 450ppm limit for 2C warming). This matters as Amazon deforestation rates have already doubled under Jair Bolsonaro’s presidency. This note explores implications, including international tensions, divestments, prioritization in a Biden presidency, and consequences for other transition technologies.


Global deforestation remains the single largest contributor to CO2e-emissions induced by man’s activities, more than the emissions from all passenger cars; and destruction of nature remains the largest overall contributor, more than all of China (chart below). This note is about a particularly worrying feedback loop in the Amazon rainforest, which could single-handedly wipe out the world’s remaining CO2 budget, effectively negating the impact of all other climate policies globally.

What is the Amazon tipping point theory?

The Amazon rainforest currently covers 5.5M square kilometers, comprising the largest, contiguous tropical forest in the world. 50% is in Brazil, and the remainder is spread around Peru, Colombia and half-a-dozen other South American countries. It contains 20% of all the planet’s plant and animal species, including 40,000 plant species alone.

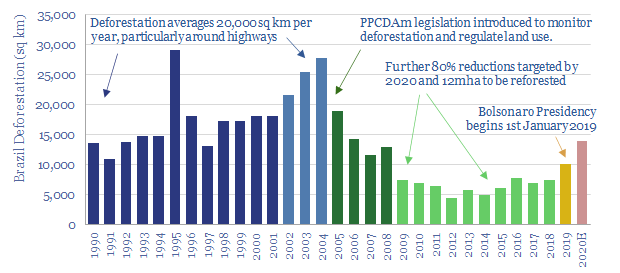
Deforestation of the Amazon has reached 15-17% of its original area overall, and around 19% in Brazil. 800,000 square kilometers has been lost to-date (a land area equivalent to 2x California; or all of France plus Germany). Brazil’s annual deforestation rates have averaged 20,000 square kilometers per year from 1990-2004 (the land area of New Jersey or Slovenia). But the rate slowed to a trough of 5,000 square kilometers in 2014 due to improving environmental policies.

Unfortunately, more recently, Brazil’s deforestation rate has re-doubled (chart below). Jair Bolsonaro’s Presidency began in January-2019, following campaign pledges to ease environmental and land use regulations (which require 80% of legal Amazon land holdings to remain uncleared). Violations of these regulations are now said to be going unpunished. Bans on planting sugarcane in the Amazon have been lifted. Bolsonaro has even repudiated data published by Brazil’s own government agencies showing deforestation rates rising and accused actor and environmentalist, Leonardo DiCaprio of starting wildfires!

This matters because of the hydrology of the Amazon. Water in the basin tends to move from East to West. Each molecule typically falls as rainfall six times. It is repeatedly taken up by trees, transpired back into the atmosphere, and precipitated back down to Earth. Over half of the rain falling in the Amazon has originated from trees in the Amazon. It is a self-sustaining feedback loop.

The Amazon Tipping Point theory predicts that below some critical level of forest cover, this self-sustaining feedback loop will break. Less rainforest means less transpiration. Less transpiration means less rainfall. Less rainfall means less rainforest. Specifically, converting each hectare of forest to cropland reduces regional precipitation by 0.5M liters/year.

After the tipping point it is feared that the basin will transition into a savanna or scrubland. 50-100% of the forest cover would die back.

Unfortunately, this is not a ‘fringe’ theory. Many different technical papers acknowledge and model the risk, although specific climate models are imprecise, and do not always agree on timings and magnitudes. For example, the Western Amazon, closer to the Andes, might retain more forests than the East and Central parts of the basin. Another uncertainty is the moderating impacts of fire, as dryer forests will be more flammable, and thus more susceptible to slash-and-burn clearances, while raging fires will also reach further.

When is the tipping point? Various technical papers have estimated that the Amazon tipping point occurs when 20-25% of the forest has been cleared. This is an additional 2-10% from today’s levels, equivalent to deforesting another 100-600k acres, which could happen within 2-30 years.

What carbon stock is at risk of being released?

A typical forest contains around 300T of carbon per hectare (chart below). Thus 5.5M square kilometers of the Amazon is expected to contain 165GT of carbon. About 40% of the carbon is usually stored in trees (estimated at 60-80GT in the Amazon) and 60% is stored in roots and soils, which degrades more slowly. Hence, if just half of the remaining Amazon disappears, this would slowly release c80GT of carbon into the atmosphere.

Each billion tons (GT) of carbon released into the atmosphere is equivalent to raising atmospheric CO2 by around 0.5ppm. Hence a 80GT carbon release from the Amazon would by itself raise atmospheric CO2 from 415ppm today to around 455ppm. This single change (notwithstanding the continued and unmitigated burning of fossil fuels) would tip the world above the 450ppm threshold needed to keep global warming to an estimated 2-degrees (climate model below).

Can the tipping point be averted?

The solution to Amazon tipping points is technically simple: stop burning down forests and start re-planting them. This does not require electrolysing water molecules into hydrogen, smoothing volatility in renewable-heavy grids, or developing next-generation batteries. It requires something much harder: international diplomacy.

Inflammatory statements? In September-2019, Bolsonaro defended his environmental policies in a speech at the UN General Assembly. International critics were accused of assaulting Brazil’s sovereignty. Brazil considers itself free to prioritize economic development over environment.

Forest for ransom? In the past, Western countries have actually paid Brazil to safeguard its rainforests, although this arrangement has now fallen apart. Specifically, the ‘Amazon Fund’ was created in 2008. It is managed by Brazilโ€™s state-owned development bank, BNDES. $1.3bn has been donated to the fund, from Norway (94%), Germany (5%) and Petrobras (1%). But after taking office, Bolsonaro has packed the fundโ€™s steering committee with members of his inner circle, and in May-2019, he started using the Fund to compensate land developers whose lands were confiscated for environmental violations. Hence Norway and Germany suspended fund payments.

Divestment and trade tensions? As Brazil’s stance on the Amazon has grown more confrontational, it is possible that decision-makers may distance themselves from the country. Global investment funds have threatened to divest. (Could Brazil even surpass the coal industry as the divestment movement’s whipping boy?). Multi-national corporations may also be more cautious around investing in the country (but probably at the margin). Finally, Amazon deforestation is said to endanger future trade deals.

The Biden Factor? President-elect Biden may also seek to influence the Amazon issue. Biden stated the world should collectively offer Brazil $20bn to stop Amazon deforestation and threaten economic consequences for refusing. An executive order re-entering the Paris Climate Agreement would also help the situation (Brazil had actually committed to restoring 12M hectares of native vegetation under the accord). It will be interesting to see how Biden balances climate-focused priorities in the US with this arguably more urgent issue abroad.

Crucial Conclusions? If the Amazon surpasses its tipping point, there would be no chance of limiting atmospheric CO2 to 450ppm or preventing a catastrophic loss of biodiversity. Diplomacy is difficult. But fortunately, decision-makers can take measures into their own hands. Our note below profiles tree-planting charities. This is the lowest-cost decarbonization option we have found in all of our research. It restores nature, including the Amazon. Ultimately, we have argued that restoring nature may the most practical route to achieving climate objectives, while ‘bursting the bubble’ of other transition technologies.

Shale productivity: snakes and ladders?

shale productivity data

Unprecedented high-grading is now occurring in the US shale industry, amidst challenging industry conditions. This means 2020-21 production surprising to the upside, and we raise our forecasts +0.7 and +0.9Mbpd respectively. Conversely, when shale activity recovers, productivity may disappoint, and we lower our 2022+ forecasts by 0.2-0.9 Mbpd. This 7-page note explores shale productivity data, and the causes and consequences of this whipsaw effect.

Biden presidency: our top ten research reports?

energy transition during Joe Biden's presidency

Joe Biden’s presidency will prioritize energy transition among its top four focus areas. Below we present our top ten pieces of research that gain increasing importance as the new landscape unfolds. We are cautious that aggressive subsidies may stoke bubbles and supply shortages in the mid-2020s. Decisions-makers will become more discerning of CO2. As usual, we focus on non-obvious opportunities.


(1) Kingmaker? There are two policy routes to accelerate the energy transition. An escalating CO2 tax could decarbonize the entire US by 2050, for a total abatement cost of $75/ton, while unlocking $3.5trn of investment. The other approach is with subsidies. This is likely to be Biden’s preferred approach. However, giving subsidies to a select few technologies tends to crowd out progress elsewhere. Who gets the subsidies is arbitrary, and thus ensues a snake-pit of lobbying. It is also more expensive, with some subsidies today costing $300-600/ton. Finally, subsidies will only achieve limited decarbonization on our models. Our 14-page note outlines these ideas and backs them up with data, to help you understand the policy landscape we are entering.

(2) Bubbles? The most direct risk of aggressive subsidies is that we fear they will stoke bubbles in the energy transition. Specifically, we have argued a frightening resemblance is appearing between prior and notorious investment bubbles (from Dutch tulips to DotCom stocks) and many of the best-known decarbonization themes today. It is driven by an expectation that government policies will grow ever more favorable, thus technical and economic challenges are being overlooked. Our 19-page note evaluates the warning signs, theme by theme, to help you understand where bubbles may be likely to build and later burst.

(3) Overbuilding renewables is a potential bubble. Our sense is that Biden’s policy team prefers to subsidize renewables today and defer the resultant volatility issues for later. But eventually, we model that this will result in power grids becoming more expensive and more volatile, which could end up having negative consequences, both for consumers and industrial competitiveness. More interestingly, we find expensive and volatile grids have historically motivated installations of combined heat and power systems behind the meter, which can also cut CO2 emissions by 6-30% compared to buying power from the grid, at 20-30% IRRs. The reason is that CHPs capture and use waste heat. Thus they achieve c70-80% thermal efficiencies, where simple cycle gas turbines only achieve c40%. The theme and opportunity are therefore explored in our 17-page note below.

(4) Over-building electric vehicles? Subsidies for EVs are also more likely under a Biden presidency. This is widely expected to destroy fossil fuel demand. Indeed a vast scale-up of EVs is present in our oil demand forecasts helping global oil demand to peak in 2023. However, our 13-page note finds this electrical vehicle ramp-up will actually increase net fossil fuel demand by +0.7Mboed from 2020-35, with gains in gas exceeding losses of oil. The reason is that manufacturing each EV battery consumes 3.7x more energy than the EV displaces each year. So there is an energy deficit in early years. But EV sales are growing exponentially, so the energy costs to manufacture ever more EVs each year outweighs the energy savings from running previous years’ EVs until the EV sales rate plateaus.

(5) Under-investment in fossil fuels? A sticking point in the presidential debates was whether President Biden would ban fracking. An impressive understanding of the energy industry was shown by his response that instead “we need a transition”. However, some have commentators continued fearmongering. We think the fearmongering is overdone. Nevertheless, at the margin, Biden’s presidency may reduce investment appetite for oil and gas. In turn, this would exacerbate the shortages we are modelling in the 2020s. A historical analogy is explored in our 8-page note, which looks back at whale oil, a barbaric lighting fuel from the 19th century. Amidst the transition to kerosene and electric lighting, whale oil supply peaked long before whale oil demand, causing strong price performance for whale oil itself, and very strong price performance for by-products such as whale bone.

(6) Under-investment in oil? Our oil market outlook in 2021-25 is published below. New changes include downward revisions to US shale supplies (particularly from 2022), increased chances of production returning in Iran, and increased production from Saudi Arabia and Russia to compensate for lower output in the US. Steep under-supply is seen in 2022, over 1Mbpd, even after OPEC has exited all production cuts. Restoring market balance in 2024-25 requires incentivizing an 8Mbpd shale scale-up. We do not believe Biden’s policies will block this shale ramp, but they may help its incentive costs re-inflate by c$5-15/bbl, particularly if Trump-era tax breaks are reversed.

https://thundersaidenergy.com/downloads/2020-oil-markets-bounding-the-uncertainty/

(7) Under-investment in gas? Where US shale growth slows, there is clearly going to be less associated gas available to feed US LNG facilities. But there may also be a lower investment appetite to construct US LNG facilities. This matters because our 12-page note below finds gas shortages are likely to be a bottleneck on decarbonization in Europe, which compounds our fears that Europe’s own decarbonization objectives could need to be walked back. Specifically, Europe must attract another 85MTpa of global LNG supplies before 2030 to meet the targets shown on the chart. This is one-third of the 240MTpa risked LNG supply growth due to occur in the 2020s, of which 100MTpa is slated to come from the United States. There is no change to our numbers yet.

(8) Lower carbon beats higher carbon? We are not fearmongering that oil and gas investment will stall under a Biden presidency. But we do believe that investment in all carbon-intensive sectors will proceed somewhat more discerningly than it would have under Trump. Low-carbon producers will be more advantaged in attracting capital, while higher-carbon producers will be penalized with higher capital costs and lower multiples. In order to help you rank different operators, we have assembled a data-file covering 13Mboed of production from major US basins, operator-by-operator (below and here) alongside our broader screens of CO2 intensity, which span across 30 different sectors, such as LNG plants, refineries, chemical facilities, cement and biofuels (here).

(9) Mitigating methane? Biden’s presidency will likely re-strengthen the EPA. Our hope is that this will accelerate the industry’s assault on leaking methane, which is a 25-120x more powerful greenhouse gas than CO2. Methane accounts for 25-30% of all man-made warming, of which c25% derives from the oil and gas industry. If 3.5% of gas is leaked across the value chain, then debatably gas is no greener than coal (the number is less than 1% in the US but can be greatly improved). Our 23-page note evaluates the best emerging technology options to mitigate methane. We are excited by replacing high-bleed pneumatics, as profiled in our short follow-up note (also below). We also see shale operators accelerating their quest for ‘CO2-neutral’ production (note below).

(10) The weatherization of 2M homes is a central part of Joe Biden’s proposed energy policy. Hence we created a data-file assessing the costs and benefits of different options. The most cost-effective way to lower home heating bills is smart thermostats. They can cut energy use c18%. Leading providers include Nest (Google), Honeywell, Emerson, Ecobee. Second most cost-effective is sealing air leaks. GE Sealants is #1 by market share in silicone sealants. Advanced plastics would also see a modest boost in demand. More questionable are large and expensive construction projects, which appear to have larger up front costs and abatement costs per ton of CO2.

Paulownia tomentosa: the miracle tree?

Empress Tree CO2 uptake

The ‘Empress Tree’ has been highlighted as a miracle solution to climate change, with potential to absorb 10x more CO2 than other tree species; while its strong, light-weight timber is prized as the “aluminium of woods”. This note investigates Empress Tree CO2 uptake. There is clear room to optimise nature based solutions. But there may be risks for the Empress.


Nature based solutions to climate change represent the largest and lowest cost opportunity in the energy transition. Those who follow our research will know we see potential to offset 15-30bn tons of CO2 emissions per year via this route (summary below).

The costs are incredibly low, at $3-10/ton, when reforestation efforts are well structured through reputable tree-planting charities (note below). Hence we argue that restoring nature will push higher-cost energy technologies off the cost curve.

Broadly, our reforestation numbers assume 3bn acres could be re-planted, absorbing 5T of CO2 per acre per year, which is the average across dozens of technical papers for typical deciduous forests in the Northern hemisphere (data-file below).

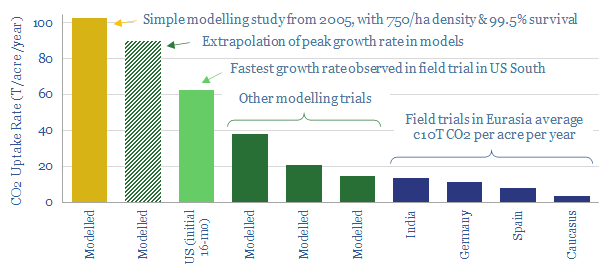
There are further optimisation opportunities to capture around 10T of CO2 per acre per year using faster-growing tree species, such as poplar, eucalyptus and mangrove. However, some commentators claim that another tree genus, known as Paulownia, can achieve an incredible 103T of CO2 offsets per acre per year.

If 100T/acre/year were possible, it would be a game-changer for the potential of reforestation. It would, in principle, only require 0.2 acres of Paulownia to offset the 20Tpa CO2 emissions of the average American. For comparison, population density in the Lower 48 is around 6 acres per American.

Paulownia: the miracle tree?

What is Paulownia? Paulownia is a tree genus, named after Princess Anna Pavlovna, daughter of Tsar Paul I of Russia (1754-1801). It has at least 6 species, of which Paulownia tomentosa is the fastest-growing “miracle” variety. This species also goes by the names: Empress Tree, Princess Tree and Kiri (Japanese).

Paulownia tomentosa can grow by a remarkable 6 meters in one year and reach 27m in height. It then adds 3-4cm of diameter to its trunk each year. It is shown below towering over the other plants in a garden (here, at about 1.5 years old).

Reasons for remarkable growth rates include that Paulownia is a C4 plant. This photosynthetic pathway produces more leaf sugar, especially in warm conditions. By contrast, most other trees are C3 plants and fix CO2 using the Rubisco enzyme, which is not saturated (creating inefficiency) and not specific (so it also wastes energy fixing oxygen). Paulownia’s leaves are also very large, helping it to absorb more light. It also simply appears to have a faster metabolism than other species. And finally, its wood is 30-40% less dense than other species, allowing it to accumulate a large size quickly.

Other Advantages?

Paulownia’s timber is highly prized and sometimes termed the โ€œaluminium of woodsโ€. It is light, at 300kg/m3 (oak is 540kg/m3) and 30% stronger than pine. It does not warp, crack or twist. It is naturally water and fire resistant. When used in flooring, it is also less slippery and softer than other woods (which is noted as advantageous for those prone to falling over). The wood is also suited to making furniture and musical instruments.

Pollutants are well absorbed by Paulownia’s large leaves, which can be 40-60cm long. Hence one study that crossed are screens examined planting Paulownia in a Northern Italian city, to reduce particulate concentrations toward recommended limits.

Other advantages are ornamental qualities with shade, โ€œwonderful purple scented flowersโ€ (below), which support honey bees, and the ability to restore degraded soils.

A final remarkable feature of Paulownia is that you can cut it down and it will re-grow, up to seven times, rapidly springing back from its stump.

Source: Wikimedia Commons

Costs of CO2 offsets using Paulownia?

Our usual model for reforestation economics is shown below, assuming a typical planting cost of $360/acre. Paulownia may be modestly more expensive to grow. Our reading suggests a broad range of $2-7/tree multiplied by c250 trees per acre in commercial plantations. The largest costs are cuttings and cultivation of saplings. Thereafter, paulownia requires โ€œminimal management and little investmentโ€. Hence if growth rates are 10x faster than traditional trees, all else equal, we would expect CO2 offset costs to be c10x lower, at $2-5/ton (including land acquisition costs at developed world prices).

Examples of Paulownia?

Over 2M hectares of Empress trees are cultivated in China, often being inter-cropped with wheat. But Paulownia cultivation in the Western world is more niche. As some examples: Jimmy Carter famously grows 15 acres of Paulownia trees on his farm in Georgia. As a commercial investment, WorldTree is an Arizona-based company that manages 2,600 acres of Empress Trees and plans to plant 30,000 acres more. It claims to be the largest grower of non-invasive Paulownia in the world. Furthermore, ECO2 is a privately owned Australian company, headquartered in Queensland. It claims to have cultivated a variety of Paulownia tree, which can reach 20m after 3-5 years and sequester 5-10x more CO2 than other trees, or around 2.5T of CO2 per tree. Finally, oil companies are exploring reforestation initiatives. For example, YPF noted in its 2018 sustainability report plans to test-plant 40 species of Empress Trees in 2019.

Problems with Paulownia?

Invasiveness? One of the largest pushbacks on reforestation is that large-scale planting of single forest varieties may impair biodiversity (a chart of all the pushbacks is below, with some irony that environmentalists call for drastic action to avert the perils of climate change, then often say, no, “not that drastic action”). In the US, Paulownia is categorized as an invasive plant. A single plant can produce 20M seeds in a year. In some States, such as Connecticut, sales of the plant are even banned. Paulownia did in fact exist in North America prior the last Ice Age. It was re-introduced from China in 1834, when seeds were accidentally released from dinnerware packaging materials. Whatever intuitions one might have, some factions are going to protest against Western cultivation of Paulownia.

But the greatest question mark over Paulownia’s CO2 offset credentials is in the numbers. Different studies are tabulated below.

Empress Tree CO2 uptake

103T of Empress Tree CO2 uptake per acre is the most widely cited number online. But this figure derives from a single study, conducted in 2005. Whose methodology is woefully rough. The study simply assumes a 12’x12′ planting of Paulownia (750/ha, 99.5% survival) and then uses a formula to estimate the CO2 uptake from the trees’ target height and width.

A follow-up study was published in 2019, estimating 38-90T of Empress Tree CO2 uptake per acre per year. But upon review, the upper bound is extrapolating the “maximum growth rate”, which is known to be 2-3x faster than the average growth rate (charts below). The study is also vague on its modelling assumptions. It was funded by a company that commercializes Paulownia plantations. Finally, the study itself notes โ€œadditional research is needed in order to quantify the carbon sequestration rates of Paulownia trees under the specific management regime employed by World Treeโ€™s Eco-Tree Program, by continuing to collect DBH values over the 10 to 12 year harvest cycle.โ€

Empress Tree CO2 uptake

Achieving monster growth rates will vary with growing conditions. Ideal conditions are warmer climates (the tolerable range is -24 to 45C), flattish, well-drained soil with pH 5-9, <25% clay, <1% salinity, <2,000m altitude, >800mm rainfall and <28kmph wind. But past studies planting the Empress Tree in Eurasia have ranged from 3-15 tons of CO2 per acre per year, which is not so remarkable versus other tree varieties.

Diseases. Finally, dense clusters of trees may fall short of growth targets due to disease. Paulownia, in particular, is susceptible to an affliction known as ‘Witches Broom’, which causes the tips of infected branches to die, leading to a cluster of dead branches. The wood is of poor quality and the growth rate of the plant diminished.

We conclude that there is great potential for nature based solutions, especially for their optimisation to boost CO2 uptake rates. Paulownia may be among the options. However, more data may be needed in the West before it can be heralded as a miracle plant.

Our key points on Empress Tree CO2 uptake are highlighted in the research note sent out to our distribution list.

Greenhouse gas: use CO2 in agriculture?

Using CO2 in agriculture and greenhouses

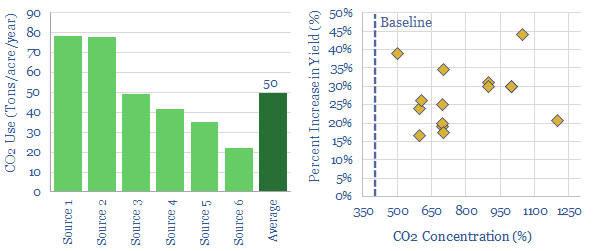
Enhancing the concentration of CO2 in greenhouses can improve agricultural yields by c30%. It costs $4-60/ton to supply this CO2, while $100-500/ton of value is unlocked. Shell and ABF have already under-taken projects using CO2 in agriculture and greenhouses, while industrial gas and monitoring companies can also benefit. But the challenge is scale. Around 50Tpa of CO2 is supplied to each acre of greenhouses. Only c10% is sequestered. So the total CO2 sequestration opportunity may be limited to around 50MTpa globally.

This 8-page note explains the opportunity, progress to date and our conclusions.

Sea levels: what implications amidst climate change?

potential mitigation opportunities amidst climate change

Global mean sea levels will rise materially by 2100, irrespective of future emissions pathways. This note contains our top ten facts for decision makers, covering the numbers, the negative consequences and the potential mitigation opportunities.


(1) Sea levels are rising, at an accelerating pace. Global mean sea levels increased by 1.4mmpa from 1901-1990, 2.1mmpa from 1970-2015, 3.2mmpa from 1993-2015 and 3.6mmpa from 2006-2015. We know this from satellite altimetry measurements, which are highly accurate and started in 1992; while older data are derived from tidal gauges and are less accurate. c40% of the recent increase is due to the thermal expansion of water as global temperatures rise, and c60% is mass gain from melting ice caps and glaciers.

(2) Sea levels are expected to rise by 0.84m by 2100 versus the 1986-2005 baseline, if global CO2 emissions keep rising and we fail to achieve an energy transition (i.e., this is the base case expected under the IPCC’s RCP 8.5 Scenario). This is driven by a continued acceleration of annual sea level rises, to 10-15 mm per year by 2100.

(3) Sea level could rise by as much as 2.5m by 2100 in the most pessimistic studies we have seen (chart below). The uncertainty between studies arises because of feedback loops that are difficult to model. For example, rising sea levels deform the Earth’s lithosphere and subtly alter the Earth’s rotation and gravitational field; we also know 90% of global warming ultimately gets stored in the oceans, but the degree of thermal expansion depends on precisely where the heat ends up being distributed.

(4) Sea levels could rise by >10m by 2500. The IPCC states that gross mean sea levels will “continue to rise for centuries” after 2100, due to lag effects in the deep ocean and in ice melt. As historical precedents, gross mean sea levels were 6-9m higher in the Last Interglacial period, 129-116ka ago, when temperatures were 0.5โ€“1.0ยบC warmer than today; and up to 6-30m higher during the mid-Pliocene Warm Period, 3.3-3.0Ma, when temperatures were 2โ€“4ยบC warmer than today. Total potential sea level rises are much larger again: The Antarctic “ice cap” covers 14M sq km, contains 26.5M cubic kilometers of ice, and would raise sea levels by 58m if it melted entirely. But modelling the long-term future of the Ice Caps remains controversial. In 2015, NASA published data showing the Antarctic Ice sheet was actually still gaining mass, as warmer air was carrying in more moisture and depositing more snowfall on the Continent, which is presently outweighing melt losses at the edge of the Western Antarctic Ice Sheet. The IPCC disagree with NASA. The University of California also finds that melt rates on the WAIS are accelerating, from 40GTpa in the 1980s to 250GTpa in the 2010s (here). 

(5) Sea levels will still rise even if we reach ‘Net Zero’. A goal in our research is to find economic opportunities that can help meet the world’s energy needs while reaching ‘net zero’ CO2 by 2050 (models below), while limiting atmospheric CO2 to 450 ppm (also below). But even if we do this, sea levels are still expected to rise by 0.43m by 2100, and continue rising thereafter, due to the same lag effects described above. 0.43m by 2100 is the latest official estimate from the IPCC, but academic estimates range from 0.3-0.7m. This is an important and surprising conclusion. All of the Herculean efforts, policy measures and novel technologies being considered today will not avert sea level rise. They will merely slow it down.

(6) Regional variations. Sea level rises are not the same everywhere. For example, Scandinavia, Northern Europe and the US Great Lakes region are still decompressing from the last Ice Age, 11,000 years ago. With the weight of these former glaciers removed, they are rising between 3-9mm per year through the process of ‘isostatic rebound’. Conversely, the US East Coast is subsiding, by c2mm per year, as it was previously a ‘glacial forebulge’, lifted up by the weight of ice pressing down on lands to the West. The steepest subsidence is in areas of rapid groundwater extraction to irrigate marginal lands. For example, much of the Nile Delta is subsiding at 0.4-3.4mm per year.

(7) Danger zones. Low lying areas are going to be inundated with rising sea levels within our lifetimes, irrespective of how the world’s energy system changes. Some of us run DCFs that go out to 2050 or even 2100. Some of us are also making decisions whose lasting impacts will stretch 30-80 years into the future. If you wish to consider the impacts of rising sea levels, then there are excellent online mapping tools such as Surging Seas showing how coastlines are expected to change over time.

(8) Negative consequences? To state the obvious, homes are prone to becoming unlivable and industrial assets are prone to becoming inoperable when they are suddenly underwater. High tides will become higher. Storm surges will reach further inland. Thus, annual flood damages are expected to be 2โ€“3 orders of magnitude higher by 2100 (Hurricane Sandy (2012, $19bn of damage) and Typhoon Winnie (1997, $3.2bn damage) are already considered the largest recorded historical flood events for New York and Shanghai, respectively). In low-lying Bangladesh, oilseed, sugarcane and jute cultivation has now stopped as rising salinity levels have impaired growing conditions. Similarly, the Nile supports 40% of Egyptโ€™s population, but large portions are only 1.5m above sea level, subsidence is running at 0.4-3.4mmpa, and salinisation will trouble traditional agriculture. This evokes fears over very large ‘displaced populations’.

(9) Large-scale coastal defences. New York City recently considered spending $119bn on a giant concrete Sea Wall, which would span 6-miles from the Rockaways in Queens, across New York Harbor, to New Jersey (the price tag is equivalent to $15k per New Yorker). Miami is also spending $2M per block to raise its roads by 2-ft. This measure needs to be combined with stormwater pumps, to ensure the roads do not channel flood waters into buildings at lower elevations. One wonders whether a vast new market will emerge for construction materials and aggregates in coastal defences (e.g., Vulcan Materials, Martin Marietta). But there is also something woefully circular about using carbon-emitting building materials (1 ton of cement emits 1 ton of CO2, charts below) to alleviate the negative consequences of CO2 emissions.

(10) Nature based solutions? Blue carbon ecosystems, such as mangroves (13.8-15.2M ha), salt marshes (2.2-40M ha) and sea grasses (17.7-60M ha) make up 2% of the total ocean area, but 50% of the total carbon sequestered in ocean sediments (here). Studies have found that mudflats and interior mangroves can accrete 4-10mm per year of elevation (here), which could help counteract rising sea levels. 30 mangrove trees per square meter can also reduce the maximum flow of surge tides by 90%, studies have found, and areas with dense mangrove cover were less affected by the 2004 Boxing Day tsunami. Those who follow our research will also know we have found nature based solutions, such as planting trees, to be among the most cost-effective ways to offset CO2 emissions. Companies including Danone, Apple, Henkel, Toyota and a French consortium have thus started planting vast numbers of mangroves as part of their environmental protection programs. Charities such as Eden Reforestation, One Tree Planted and Sea Trees offer similar opportunities for individuals.

Sources, Acronyms & Terms

Oppenheimer, M., B.C. Glavovic , J. Hinkel, R. van de Wal, A.K. Magnan, A. Abd-Elgawad, R. Cai, M. Cifuentes-Jara, R.M. DeConto, T. Ghosh, J. Hay, F. Isla, B. Marzeion, B. Meyssignac, and Z. Sebesvari. (2019). Sea Level Rise and Implications for Low-Lying Islands, Coasts and Communities. In: IPCC Special Report on the Ocean and Cryosphere in a Changing Climate.

GMSL = global mean sea level, on average, smoothing waves, surges and tides

RSL = relative sea level rises.

ESL = extreme sea level events

RCP = Representative Concentration Pathway emissions scenario.

RCP2.6 assumes Net Zero in the late 21st century and <2C of warming.

RCP8.5 is a โ€˜worst case scenarioโ€™ where emissions keep rising to 2100.

GIS = the Greenland Ice Sheet

AIS = the Antarctic Ice Sheet

SMB = surface mass balance, the gain or loss of ice from ice sheets

Ice Shelves = the floating extensions of grounded ice flowing into oceans

US shale: our outlook in the energy transition?

US shale outlook in the Energy Transition

This presentation covers our outlook for the US shale industry in the energy transition, and was presented at a recent investor conference. The presentation is free to download for TSE subscription clients.


The importance of shale oil supplies in a fully decarbonized energy system is contextualized on pages 1-7. Production must grow by a vast 2.6Mbpd in 2022-25 to keep oil markets well supplied, even as oil demand plateaus. Otherwise, devastating oil shortages may de-rail the transition.

This requires a 5% CAGR in shale productivity. We argue in favor of future productivity growth, based on the evidence from 950 technical papers, which we have reviewed, on pages 8-12.

But can the industry attract capital? This now hinges upon carbon credentials. Laggards will have >25kg/boe of upstream CO2 while leaders have the opportunity to be CO2-neutral. The division (and the  prize) is outlined on pages 13-19.

Our conclusions for the US Shale outlook in the energy transition, based on technology productivity and CO2, are summarised in our presentation here.

Copyright: Thunder Said Energy, 2019-2024.