-
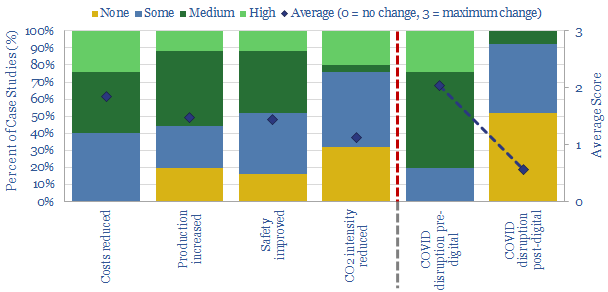
Digitization after the crisis: who benefits and how much?

Digitization improves economics and CO2 credentials. But now it will structurally accelerate due to higher resiliency: Just 8% of digitized industrial processes will be disrupted due to COVID-19, compared to 80% of non-digitized processes. This 22-page report outlines the theme and who will benefit.
-
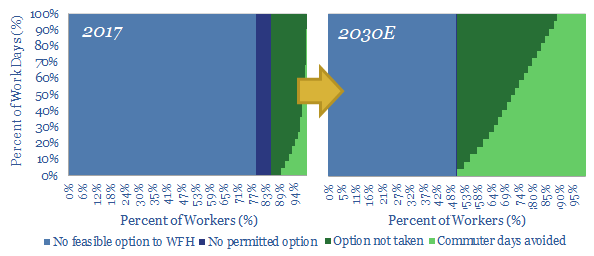
Remote possibilities: working from home?

The COVID-19 crisis will structurally accelerate remote working. The opportunity can save 30% of commuter journeys by 2030, avoiding 1bn tons of CO2 per year, for a net economic benefit of $5-16k per employee. This makes remote work materially more impactful than electric vehicles, as an opportunity in the energy transition.
-
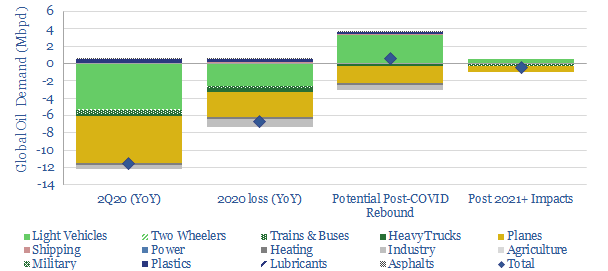
COVID-19: what have the oil markets missed?

This 15-page note outlines our top three conclusions about COVID-19, which the oil markets may have missed. Global oil demand could decline by -11.5Mbpd YoY in 2Q20. But gasoline demand could increase in the aftermath of the crisis. Finally, longer-term, structural changes will transform commuting, retail and travel.
-
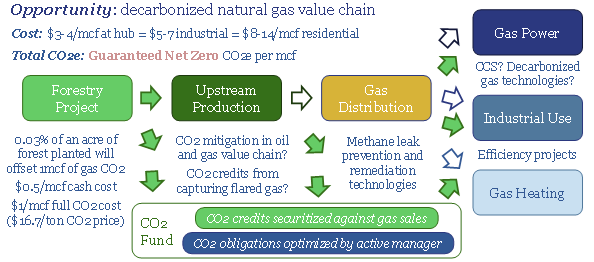
How to decarbonize gas value chains?

Gas value chains present the largest and lowest cost decarbonization opportunity on the planet, commercialising zero carbon energy for an incremental cost below $1/mcfe ($17/ton of CO2). This 15-page report outlines how to optimize a decarbonized gas value chain, securitizing forestry-based carbon commitments in an actively managed carbon fund.
-
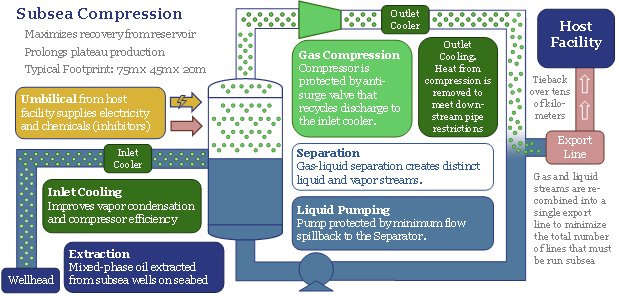
The future of offshore: fully subsea?

Offshore developments will change dramatically in the 2020s, eliminating production platforms in favour of fully subsea solutions. The opportunity increases a project’s NPV by 50% and effectively eliminates upstream CO2. We reviewed 1,850 patents to find the best-placed operators and services. Others will be disrupted. The theme supports the ascent of low-carbon natural gas.
-
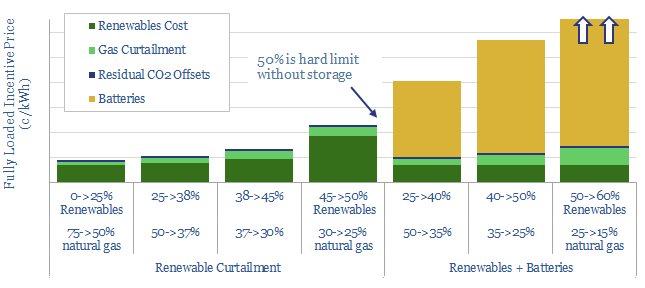
Decarbonized power: how much wind and solar fit the optimal grid?

What is the optimal mix of wind and solar in a low-cost, zero-carbon power grid? We find renewables cannot surpass 45-50% due to curtailment, which trebles prices. Batteries help little, under grid conditions. Decarbonized gas is the best backstop. A grid of 50% decarbonized gas, 25% renewables and 25% nuclear has the lowest incentive price,…
-
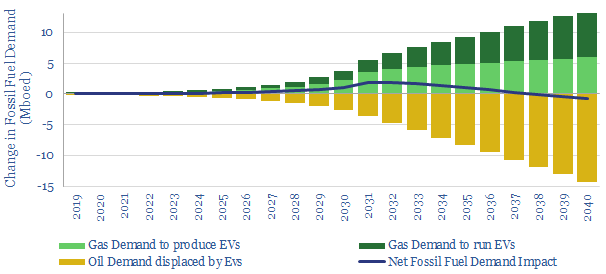
Electric Vehicles Increase Fossil Fuel Demand?

It is widely believed that electric vehicles will destroy fossil fuel demand. We find they will increase it by 0.7Mboed from 2020-35. The reason is that 3.7x more energy is consumed to manufacture each EV than the net road fuel it displaces each year; while manufacturing of EVs is seen growing exponentially. The finding is…
-
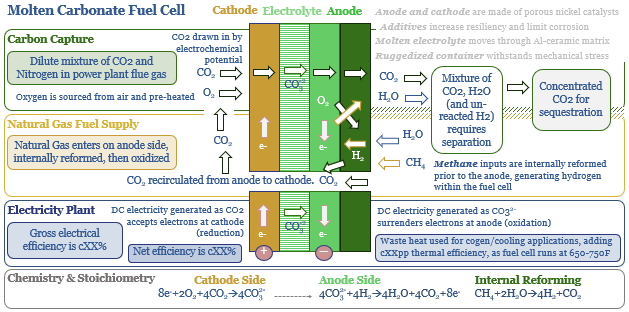
MCFCs: what if carbon capture generated electricity?

Molten carbonate fuel cells (MCFCs) could be a game-changer for CCS and fossil fuels. They capture CO2 from combustion facilities; while at the same time, generating electricity from natural gas. The first pilot plant is being tested in 1Q20, by ExxonMobil and FuelCell Energy. Economics range from passable to phenomenal.
-
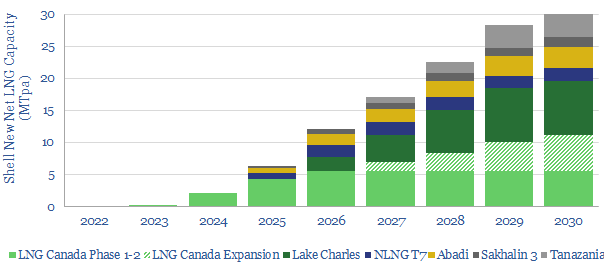
Shell: the future of LNG plants?

Shell is revolutionizing LNG project design, based on reviewing 40 of the company’s gas-focused patents from 2019. The innovations can lower LNG facilities’ capex by 70% and opex by 50%; conferring a $4bn NPV and 4% IRR advantage over industry standard greenfields. Our 16-page note reviews Shell’s operational improvements, revolutionary greenfield concepts, and their economic…
-
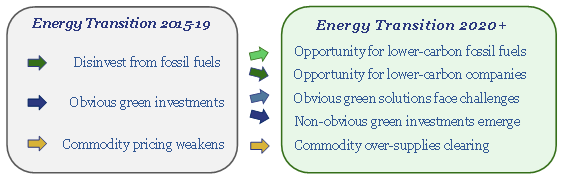
Ten Themes for Energy in 2020

Energy transition is maturing as an investment theme. ‘Obvious’ portfolio tilts are beginning to look over-crowded. Non-obvious ones are over-looked. This 26-page note outlines the ‘top ten’ opportunities that excite us most in 2020, among commodities, drivers of the energy transition, evolving market perceptions and forward-thinking corporate strategies.
Content by Category
- Batteries (89)
- Biofuels (44)
- Carbon Intensity (49)
- CCS (63)
- CO2 Removals (9)
- Coal (38)
- Company Diligence (95)
- Data Models (840)
- Decarbonization (160)
- Demand (110)
- Digital (60)
- Downstream (44)
- Economic Model (205)
- Energy Efficiency (75)
- Hydrogen (63)
- Industry Data (279)
- LNG (48)
- Materials (82)
- Metals (80)
- Midstream (43)
- Natural Gas (149)
- Nature (76)
- Nuclear (23)
- Oil (164)
- Patents (38)
- Plastics (44)
- Power Grids (130)
- Renewables (149)
- Screen (117)
- Semiconductors (32)
- Shale (51)
- Solar (68)
- Supply-Demand (45)
- Vehicles (90)
- Wind (44)
- Written Research (354)