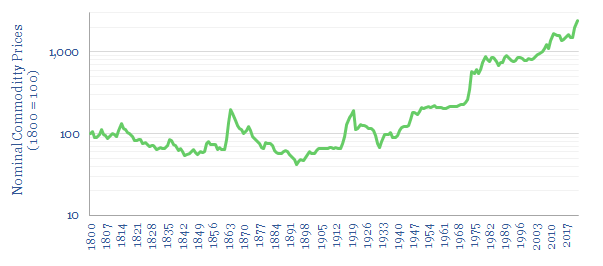
This data-file aggregates long-term historical commodity prices back to 1800, predominantly in the US, using academic records and census data. Historical commodity prices generally fell 30-70% in the 19th and early 20th century, punctuated by supply disruptions due to wars, then rose by 12.5x from 1945 to the present day.
This data-file aggregates long-term historical commodity prices going back to 1800, and running up until 1970, predominantly in the US, using academic records and census data. All of the data are shown in current pricing terms (i.e. nominal prices of the time).
Covered commodities include bricks, coal, copper, cotton, nails, rock oil, steel rails, sugar, turpentine, whale oil, wheat and wood. A combined profile of all of these commodities is aggregated in the index above.
Aggregate commodity prices had fallen by 50% from 1800 to 1900, interspersed by volatility associated with wars (e.g., the US Civil War). Aggregate commodity prices then doubled between the Inter-war period and 1945, then rose by 12.5x from the 1950s to 2023.
In particular, we focus in upon the disruption of whale oil as a lighting fuel and the disruption of wood as a heating fuel, using granular data into pricing and demand. Our conclusions are presented in a research note linked here.
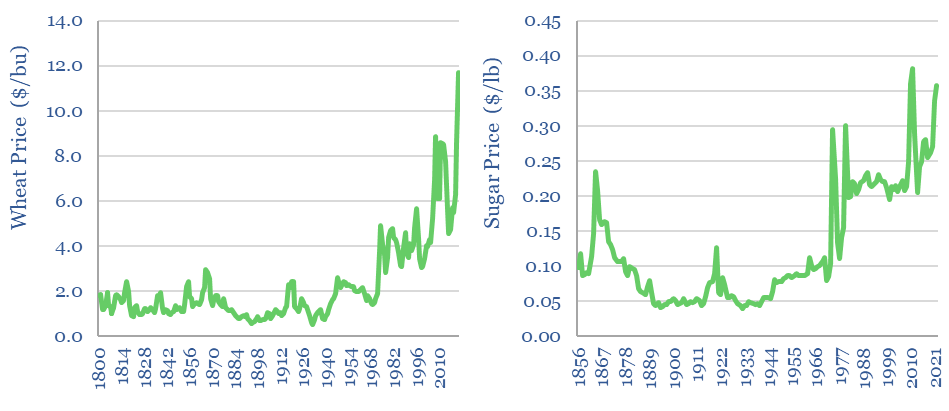
Agricultural commodities followed the pattern of deflating in the 19th century, followed by sharp rises since the inflationary shocks of the 1970s. Generally, wheat prices and sugar prices have now risen by 7x since 1800.
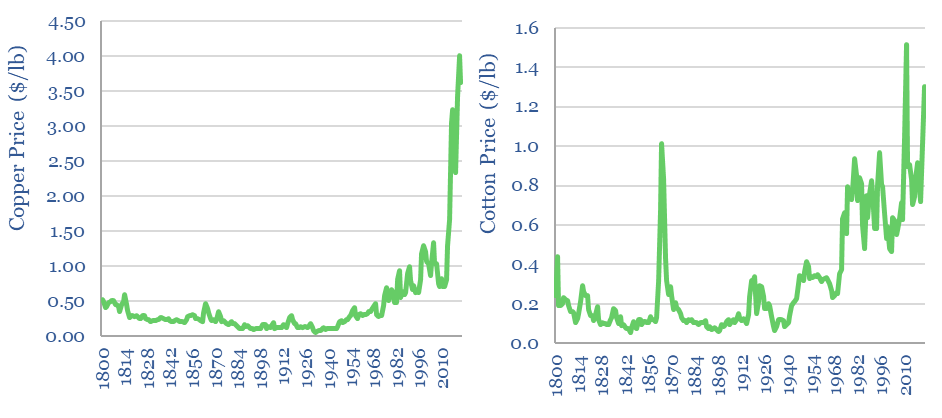
Materials commodities also followed the pattern of deflating in the 19th century, if we take examples such as very long term copper prices, or very long term cotton prices. These have risen by 7-8x from 1800 levels by the present day. Note the extremely large upside volatility for cotton prices during the US Civil War of 1861-1865.
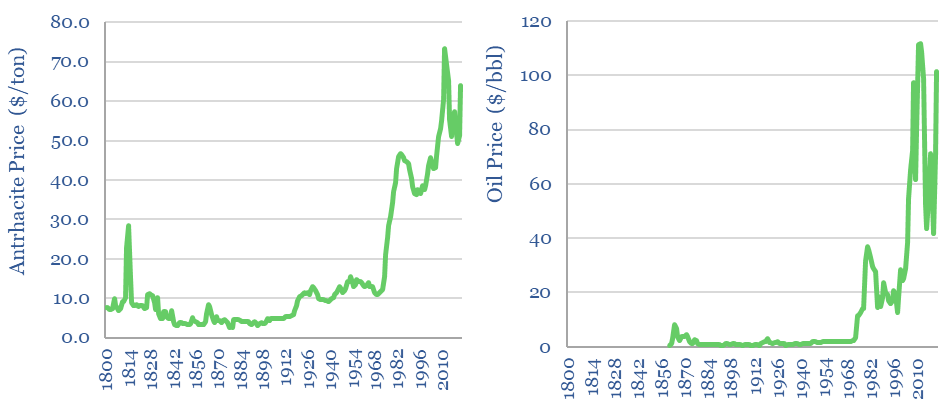
Energy prices have showed the largest price inflation among very long term commodity price data in our data-file. Very long term coal prices fell by 70% from 1800 to 1900, then rose by 16x by 2022. Likewise, oil prices fell from $8/bbl during the first ol book in 1864 to below $1/bbl in 1901, before rising 100x in 2022.
Other commodity price data sources? More recent commodity price performance, across a broad range of materials commodities, is captured in our commodity price database here. Commodities’ performance during recessions is aggregated here. Electricity prices are here. Gas prices are here. For an excellent open source database freely available from a third party we recommend the World Bank’s pink sheets.