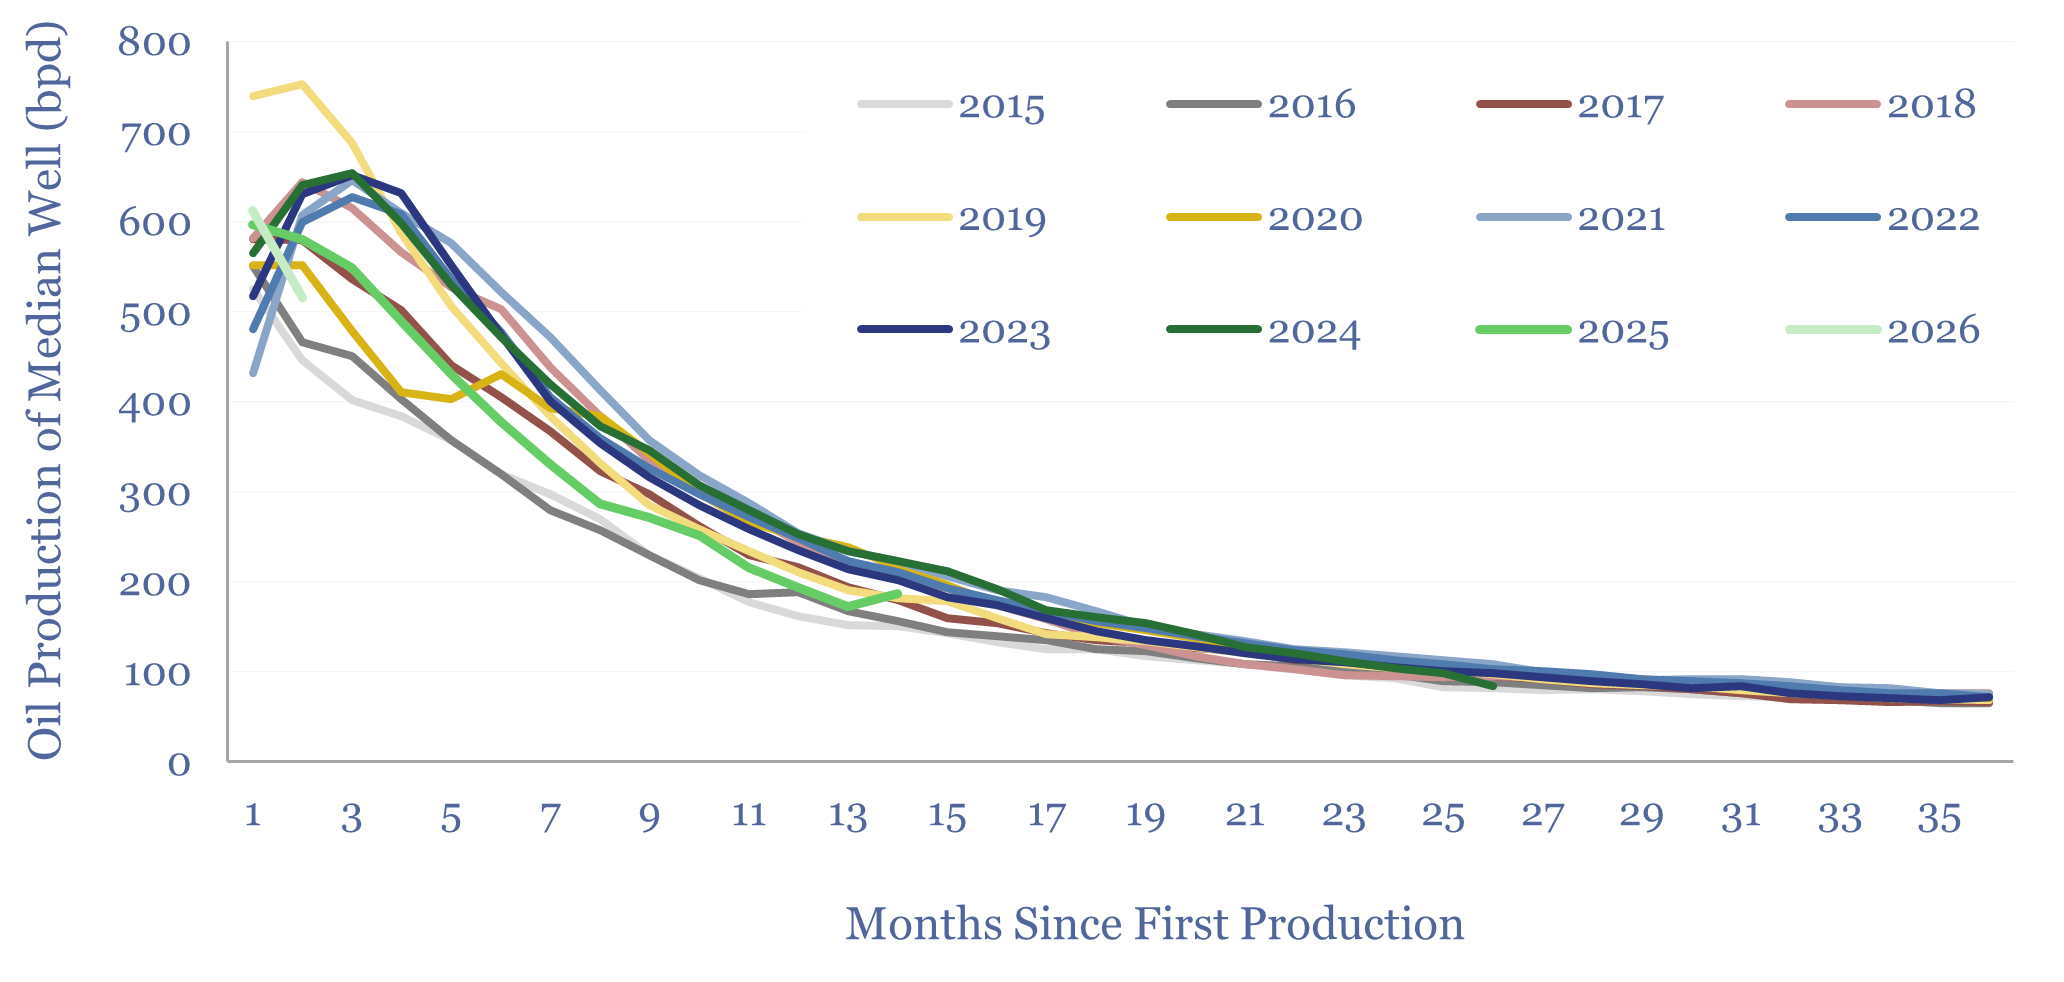
This data-file aggregates the monthly production data from 10,000 wells in the Bakken, which were drilled and completed over the past decade from 2015 to early 2026. Average Year 1 oil production quadrupled from 2006 to reach 360bpd in 2015-16, continued rising to a peak of 460bpd in 2021, flatlined at 440bpd in 2022-24 and fell to 380bpd in 2025. Some may see this as a sign of resource maturation.
The Bakken Shale is a Devonian-Mississippian formation, covering 45,000 sq km in the Willison Basin of North Dakota and Montana, at an average depth of 2,300m, an average thickness of 14m and holding around 5bn bbls of oil resources.
Bakken production is tracked in our US shale models, at 1.8Mboed in 2025, including 1.2Mbpd of oil, 0.2Mbpd of NGLs and 2.5 bcfd of gas production. Over 800 wells were drilled and completed by a fleet of c30 rigs. Our forecasts see production running flat through 2030.
But is the Bakken maturing? To answer this question, we have aggregated the monthly production from 10,000 wells, completed in the Bakken since mid-2015.
Underlying data come from the North Dakota Department of Mineral Resources, which we have aggregated across monthly reports, going back to 2015.
Average Year 1 oil production in the Bakken quadrupled from 2006 to reach 360bpd in 2015-16, continued rising to a peak of 460bpd in 2021, flatlined at 440bpd in 2022-24 and then fell to 380bpd in 2025. Some may see this as a sign of resource maturation.
This is very different from the trajectory we see in the Marcellus, where type curves continued making all-time peaks in 2025.
Really all shale is an ongoing battle between resource maturation and technological gains. We see the latter being driven by AI and big data approaches and by Oil Service technologies.
Another counterfactual may be that operators choked back their wells amidst lower oil prices ($65/bbl in 2025) and a perception that oil markets were oversupplied.
Production rates also varied sharply by operator. We have aggregated the number of wells completed, and production rates per well, and “Bakken type curves” over time, across the basin’s top ten producers.
Operators covered in the data-file include Chord, Conoco, Continental, Devon, EOG, Equinor, ExxonMobil, Hess, Hunt and Marathon. Type curves vary starkly by operator. All of the data are in this large, 16MB data-file.