This data-file tabulates globally traded capital goods market sizes, based on the values of products exported from different countries-regions. Specifically, commodity Code 84 represents machinery and mechanical appliances, worth $2.5trn pa in 2023, about half of which are classic capital goods categories, as decomposed in the chart above. We also updated this file to include Code 85, disaggregating global electrical capital goods exports.
Mechanical capital goods comprise about 60 underlying markets. These capital goods market sizes average c$80bn each, of which c$30bn is exported globally, i.e., 35-40% of the total market, as a rule of thumb. At least this is our best estimate, using the UN Comtrade‘s export data as a proxy. Everyone knows that capital goods are complex, but this breakdown explains why capital goods analysts can feel overwhelmed, and/or get teased by their colleagues for writing research notes about washing machines (a $60bn pa market after all, of which c$13bn pa is globally traded).
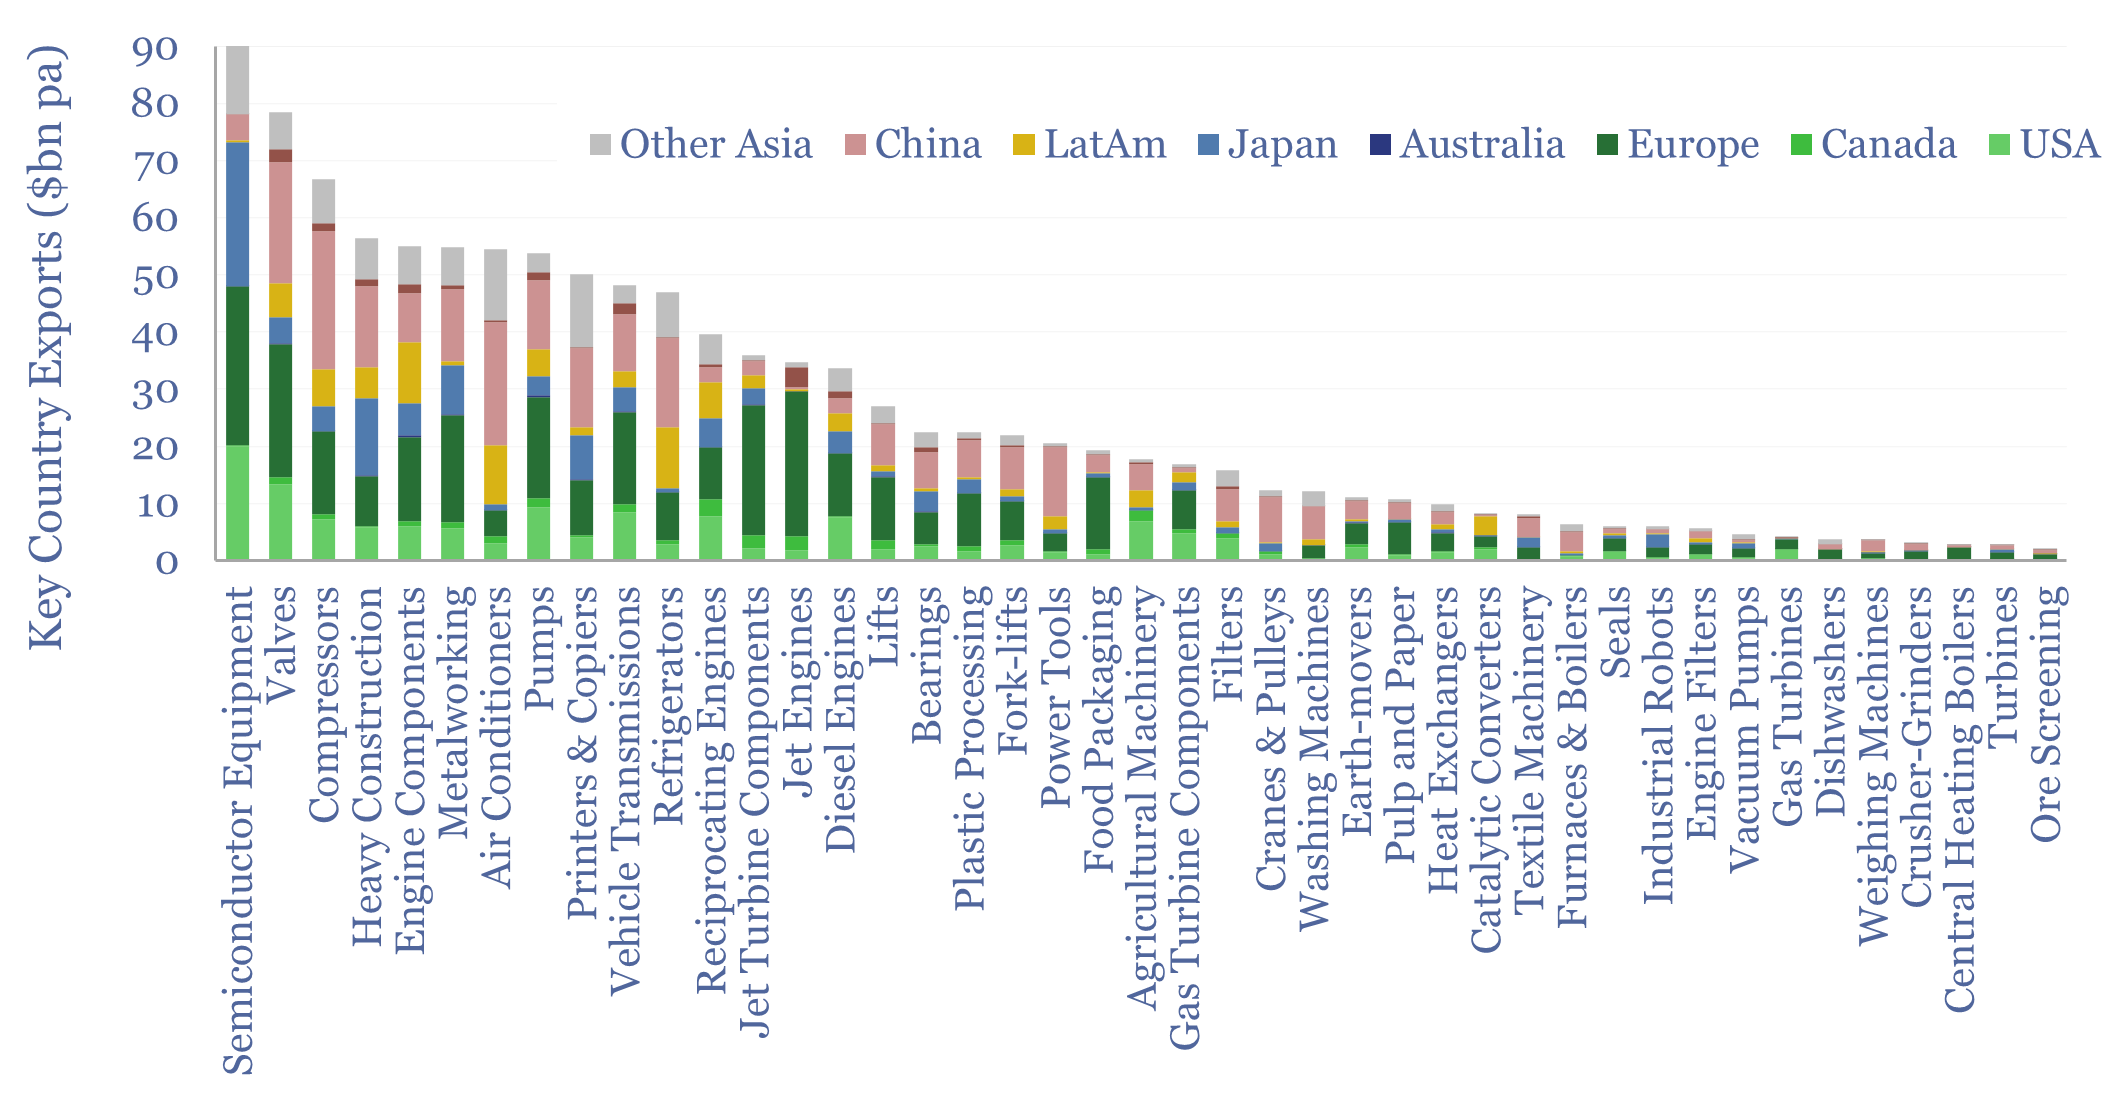
The largest mechanical goods categories, weighted by global exports are engines ($170 bn pa), semiconductor manufacturing equipment ($90bn pa), valves ($80bn pa), compressors ($70bn pa), heavy construction equipment ($60bn pa), engine components ($60bn pa), metal-working equipment ($60bn pa), pumps ($60bn pa), agricultural machinery ($30bn pa), filters ($30bn pa), lifts ($30bn pa), bearings ($20bn pa) and heat-exchangers ($10bn pa).
China has come to dominate the world’s supply of solar modules, lithium ion batteries and Rare Earths, but not so much in broader capital goods. Europe is the world leader in exporting mechanical capital goods, at 30% of the global export market, followed by China at 23%, the US at 13%, Japan at 10%, LatAm at 10%, and other Asia at 10%. Europe especially dominates in jet engines (c70% of global exports), food packaging equipment (60%), gas turbines (40%), elevators/lifts (40%), and some categories of mine equipment (40%). Contrary to popular belief, Europe is not ‘industrially dead’, but highly specialized towards high-quality manufacturing; and as Europe shifts towards more competitive policies, there really could be overlooked value here?
Global gas turbine capex ran at $50bn pa in 2019-24, yet only c10% of this market (c$5bn pa) comprised the export of fully assembled gas turbines, versus $17bn pa of gas turbine components (example here), plus other components such as valves and seals. Most large-scale capital goods conglomerates source the best parts globally, and then complete manufacturing near to the point of delivery, and again this creates a moat around whoever produces high-quality parts.
Growth in the global exports of mechanical capital goods (commodity code 84) has averaged 2% pa over the past decade. The fastest growth has been in semiconductor equipment (10% pa), industrial robots (7%) and jet engines (7%). Other categories became less industrially relevant, such as industrial boilers (-5% pa) or textile machinery (-4%). Other categories grew in volume terms, but declined in value terms due to deflation, such as personal computers (-0.2% pa) and computer accessories (-2% pa).
We have updated this file with commodity code 85, representing electrical capital goods, worth $2trn globally in 2023. Electrical goods exports have been growing at 4% pa in the past decade, which is twice the growth of mechanical goods, but volume growth is also much higher, as the overall numbers include cost deflation (e.g., solar module sales volumes have risen at 25% pa as costs fell at -15% pa). In this category China is much more dominant, at 38% of global exports. Other Asia is 32%, Europe is 10%, the US is 8% and Japan is 4%.
All of the underlying data, by capital goods category, by exporter, by value and over time are broken down in the data-file. This work informs our broader estimates of market sizes. Please also see our broader research into shifting global trade and the breakdown of trade flows by country pairs.