Carbon Intensity
-
Carbon Costs of IMO 2020?
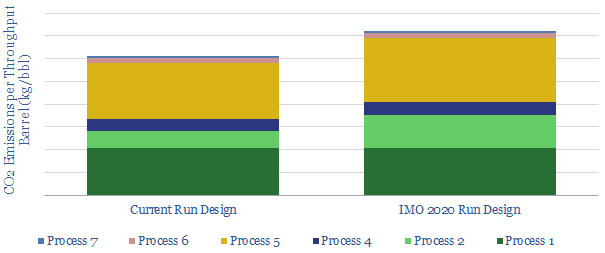
CO2 intensity of oil refineries could rise by 20% due to IMO 2020 sulphur regulations, if all high-sulphur fuel oil is upgraded into low-sulphur diesel, we estimate. The drivers are an extra stage of cracking, plus higher-temperature hydrotreating, which will also increase hydrogen demands. This one change could undo 30-years of efficiency gains.
-
Development Concepts: how much CO2?
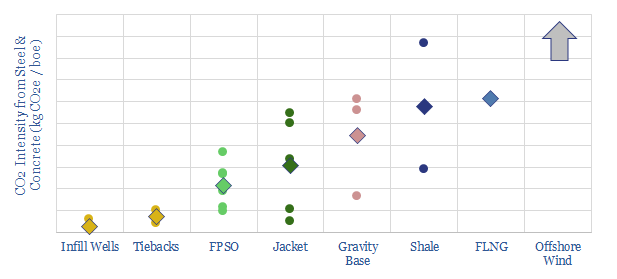
We tabulate c25 oil projects, breaking down the total tons of steel and concrete used in their topsides, jackets, hulls, wells, SURF and pipelines. Infill wells, tiebacks and FPSOs make the most CO2-efficient use of construction materials per barrel of production, helping to minimise emissions. Fixed leg platforms are higher CO2, then gravity based structures, then…
-
Global Flaring Intensity by Country
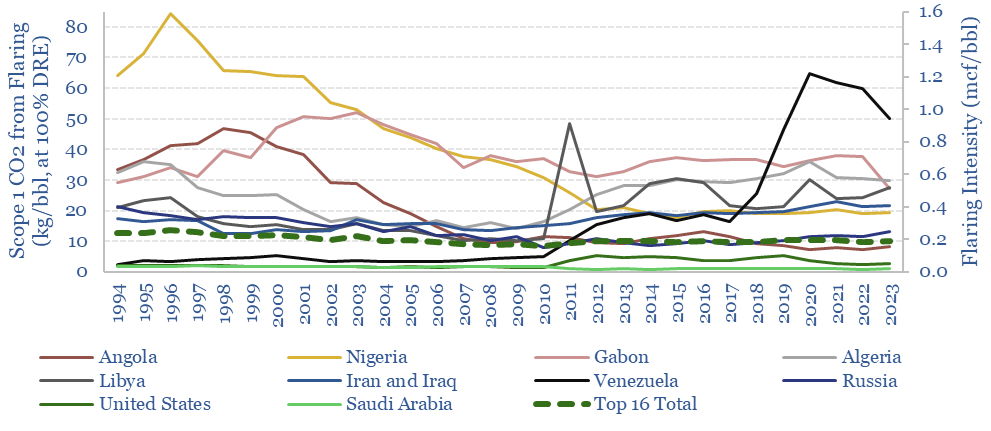
This data-file tabulates global flaring intensity in 16 countries: in absolute terms (bcm per year), per barrel of oil production (mcf/bbl) and as a contribution to CO2 emissions (kg/boe). 2021 saw 144bcm of global flaring, averaging 0.2 mcf/bbl and 10 kg/boe of direct emissions. Lower decile countries flared 0.7 mcf/bbl, which is over 40 kg/boe.
-
Value in Use: CO2 intensities of household items?
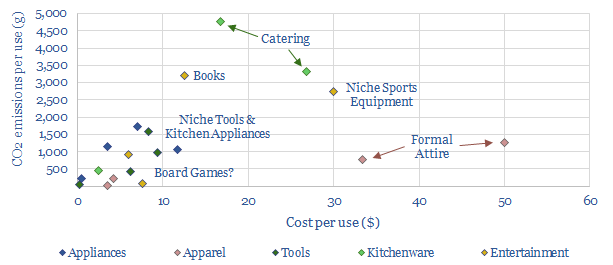
More extensive “sharing” will be enabled by drone delivery technologies and could save $1trn of costs and 100MTpa of CO2 emissions across the entire US. These numbers are illustrated by tabulating the data for 20 common household items, which we estimate are currently used just 20 times in their entire useful lives, thus costing $13…
-
CO2 intensity of natural gas value chains?
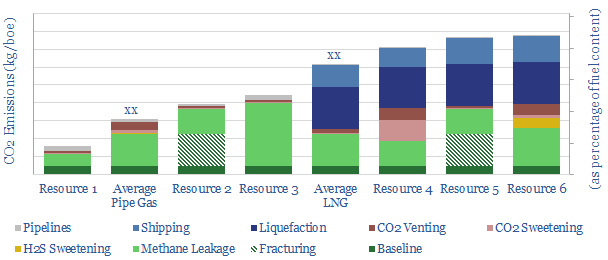
We have constructed a simple model to estimate full-cycle CO2 emissions of a gas resource, as a function of its production efficiency, contaminants (CO2 and H2S), and commercialisation (LNG or pipelines) . Compared with the life-cycle emissions of oil, CO2 per boe is seen to be c0-20% lower for LNG and c50-75% lower for piped…
-
Oil industry CO2 per barrel?
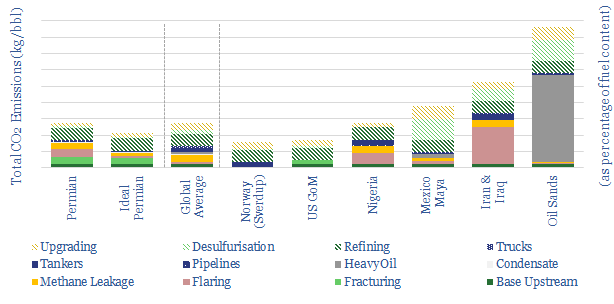
We have constructed a simple model to estimate full-cycle CO2 emissions of an oil resource, as a function of its flaring, methane leakage, gravity, sulphur content, production processes and transportation to market. A c10x energy return on energy investment is estimated. Relative advantages are seen for well-managed resources offshore and in shale; relative disadvantages are…
-
Vehicles: fuel economy and energy efficiency?
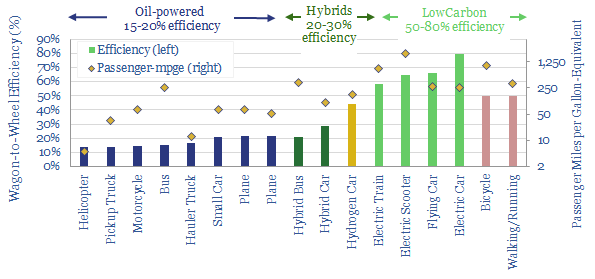
We have quantified the energy efficiency of 14 different transportation technologies, using real-world data and mechanics equations. Electrification raises auto efficiency 4x, from c15-20% to c60-80%. Novel electric technologies are also unlocking unprecedented fuel economies per passenger mile.
-
The World’s Great Gas Fields and Their CO2
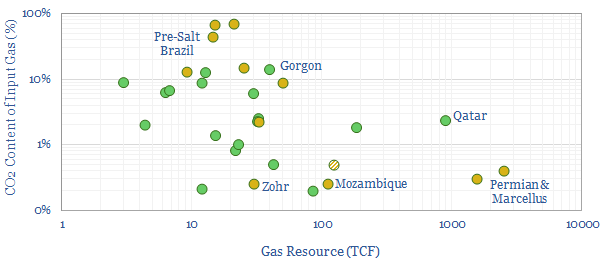
This data-file tabulates 30 major gas resources around the world, their volumes, their CO2 content and how the CO2 is handled. This matters because higher CO2 gas fields are more costly to develop into LNG, while CO2 venting is no longer acceptable without CCS. Permian & Marcellus LNG are best positioned.
Content by Category
- Batteries (96)
- Biofuels (44)
- Carbon Intensity (48)
- CCS (64)
- CO2 Removals (9)
- Coal (41)
- Commentary (65)
- Company Diligence (104)
- Data Models (921)
- Decarbonization (162)
- Demand (129)
- Digital (86)
- Downstream (47)
- Economic Model (220)
- Energy Efficiency (76)
- Hydrogen (63)
- Industry Data (308)
- LNG (56)
- Materials (86)
- Metals (88)
- Midstream (45)
- Natural Gas (161)
- Nature (76)
- Nuclear (28)
- Oil (175)
- Patents (39)
- Plastics (44)
- Power Grids (155)
- Renewables (153)
- Screen (137)
- Semiconductors (35)
- Shale (58)
- Solar (72)
- Supply-Demand (53)
- Vehicles (95)
- Video (24)
- Wind (47)
- Written Research (406)